Data download: Difference between revisions
No edit summary |
mNo edit summary |
||
| Line 10: | Line 10: | ||
| format=count | | format=count | ||
}}'''</i></font><br> | }}'''</i></font><br> | ||
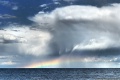
Type: | Type: Tropical cyclones, Tropical rainfall, Global station data. | ||
|- | |- | ||
|valign=top|[[Image:Tidewaterdisko.png|left|x150px|120px|link=Cryosphere data|alt=Cryosphere data ]] | |valign=top|[[Image:Tidewaterdisko.png|left|x150px|120px|link=Cryosphere data|alt=Cryosphere data ]] | ||
| Line 18: | Line 18: | ||
| format=count | | format=count | ||
}}'''</i></font><br> | }}'''</i></font><br> | ||
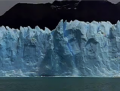
Type: | Type: Paleo ice sheet thickness, sea ice concentrations, world glaciers. | ||
|- | |- | ||
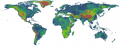
|valign=top|[[Image:GPW.png|left|x150px|120px|link=Human dimensions data]] | |valign=top|[[Image:GPW.png|left|x150px|120px|link=Human dimensions data]] | ||
| Line 26: | Line 26: | ||
| format=count | | format=count | ||
}}'''</i></font><br> | }}'''</i></font><br> | ||
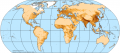
Type: | Type: Population of the world. | ||
|- | |- | ||
|valign=top|[[Image:CM_Capture_3.png|left|x150px|120px|link=Hydrography data]] | |valign=top|[[Image:CM_Capture_3.png|left|x150px|120px|link=Hydrography data]] | ||
| Line 34: | Line 34: | ||
| format=count | | format=count | ||
}}'''</i></font><br> | }}'''</i></font><br> | ||
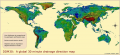
Type: | Type: Global drainage direction map, Hydro1k, HydroSHEDs, SWBD. | ||
|- | |- | ||
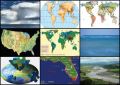
|valign=top|[[Image:NLCD1992.jpg|left|120px|link=Land cover data|alt=Land cover data ]] | |valign=top|[[Image:NLCD1992.jpg|left|120px|link=Land cover data|alt=Land cover data ]] | ||
| Line 42: | Line 42: | ||
| format=count | | format=count | ||
}}'''</i></font><br> | }}'''</i></font><br> | ||
Type:. | Type: Land cover dataset of America. | ||
|- | |- | ||
|valign=top|[[Image:Ocean creative commons akahodag.jpg|left|120px|link=Oceanography data|alt=Oceanography data]] | |valign=top|[[Image:Ocean creative commons akahodag.jpg|left|120px|link=Oceanography data|alt=Oceanography data]] | ||
| Line 51: | Line 50: | ||
| format=count | | format=count | ||
}}'''</i></font><br> | }}'''</i></font><br> | ||
Type: Ocean layers, surface currents, coral reefs, sediment thickness, tides, waves. | |||
|- | |- | ||
|valign=top|[[Image:T025_james_syvitski.jpg|left|120px|link=River discharge data|alt=River discharge data ]] | |valign=top|[[Image:T025_james_syvitski.jpg|left|120px|link=River discharge data|alt=River discharge data ]] | ||
| Line 59: | Line 58: | ||
| format=count | | format=count | ||
}}'''</i></font><br> | }}'''</i></font><br> | ||
Type: Global runoff, historical water levels, streamflow, sediment data, | |||
|- | |- | ||
|valign=top|[[Image:HWSD.jpg|left|120px|link=Surface properties data|alt=Surface properties data ]] | |valign=top|[[Image:HWSD.jpg|left|120px|link=Surface properties data|alt=Surface properties data ]] | ||
| Line 66: | Line 66: | ||
| format=count | | format=count | ||
}}'''</i></font><br> | }}'''</i></font><br> | ||
Type: World soil database. | |||
|- | |- | ||
|valign=top|[[Image:Sea level Creative commons Flickr Maitri.gif|left|120px|link=Sea level data|alt=Sea level data ]] | |valign=top|[[Image:Sea level Creative commons Flickr Maitri.gif|left|120px|link=Sea level data|alt=Sea level data ]] | ||
| Line 73: | Line 74: | ||
| format=count | | format=count | ||
}}'''</i></font><br> | }}'''</i></font><br> | ||
Type: Mean sea level over time. | |||
|- | |- | ||
|valign=top|[[Image:OneGeology.png|left|120px|link=Substrates data|alt=Substrates data ]] | |valign=top|[[Image:OneGeology.png|left|120px|link=Substrates data|alt=Substrates data ]] | ||
| Line 80: | Line 82: | ||
| format=count | | format=count | ||
}}'''</i></font><br> | }}'''</i></font><br> | ||
Type: Material and features of the global seafloor, geological map. | |||
|- | |- | ||
|valign=top|[[Image:Topography data image.png|left|120px|link=Topography data|alt=Topography data ]] | |valign=top|[[Image:Topography data image.png|left|120px|link=Topography data|alt=Topography data ]] | ||
| Line 87: | Line 90: | ||
| format=count | | format=count | ||
}}'''</i></font><br> | }}'''</i></font><br> | ||
Type: Land and ocean relief data at various scales, and world vector shoreline | |||
|- | |- | ||
|valign=top|[[Image:Data image all combination.png|left|120px|link=All data|alt=All data ]] | |valign=top|[[Image:Data image all combination.png|left|120px|link=All data|alt=All data ]] | ||
| Line 94: | Line 98: | ||
| format=count | | format=count | ||
}}'''</i></font><br> | }}'''</i></font><br> | ||
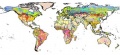
Type: All of the data described above. | |||
|- | |- | ||
|} | |} | ||
Revision as of 15:42, 10 December 2010
Download data
| Data | |
|---|---|
 |
Climate data
Nr. of datasets: 7The part "]]" of the query was not understood.</br>Results might not be as expected. |
 |
Cryosphere data
Nr. of datasets: 5The part "]]" of the query was not understood.</br>Results might not be as expected. |
 |
Human dimensions data
Nr. of datasets: 4The part "]]" of the query was not understood.</br>Results might not be as expected. |
 |
Hydrography data
Nr. of datasets: 8The part "]]" of the query was not understood.</br>Results might not be as expected. |
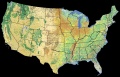 |
Land cover data
Nr. of datasets: 10The part "]]" of the query was not understood.</br>Results might not be as expected. |
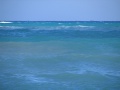 |
Oceanography
Nr. of datasets: 12The part "]]" of the query was not understood.</br>Results might not be as expected. |
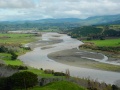 |
River discharge data
Nr. of datasets: 11The part "]]" of the query was not understood.</br>Results might not be as expected. |
 |
Surface properties data
Nr. of datasets: 9The part "]]" of the query was not understood.</br>Results might not be as expected. |
 |
Sea level data
Nr. of datasets: 1The part "]]" of the query was not understood.</br>Results might not be as expected. |
 |
Substrates data
Nr. of datasets: 5The part "]]" of the query was not understood.</br>Results might not be as expected. |
 |
Topography data
Nr. of datasets: 23The part "]]" of the query was not understood.</br>Results might not be as expected. |
 |
All data
Nr. of datasets: <ul><li>The part "]]" of the query was not understood.Results might not be as expected.</li> <!--br--><li>Some subquery has no valid condition.</li></ul> |
