Between the Bytes


You pass your 35 millionth birthday. Somewhere up at the surface, drama is happening. Most of life on earth perishes; then, what’s left of it goes on. By your 100 millionth birthday, dinosaurs are hunting and foraging in the sand and mud of a river somewhere above you. One by one they live their lives, leave their bones in the mud, and are buried. Their stony grave becomes the Kayenta Formation, stained dark red by the rusting groundwaters.
The Kayenta’s dinosaurs rest in their rocky grave for over 100 million more years. Below them you sleep too. Then something wakes you up. A shaking, a bending, and a hoisting. A tectonic shove from beyond and below. From the north and east come the distant vibrations of lurching mountains. Here in your chunk of land, the carpet wrinkles: rising on the west, sinking on the east, kinking in between. The Kayenta layer is now sharply bent. This bending is ancient too.
Now, a rising and a scraping and a clawing. Rivers drag their rocks, cutting; water soaks the stone back into sand. An unpeeling. Somewhere on the land above, sunlight beams on a sliver of red rock. Flood by flood, the dinosaur’s gravestone is etched open, its high parts carried off to the sea, and its low parts still buried for now. In between, the kink becomes a ridge. A few miles to the west, daylight blinds you (or would if you had eyes) as a slab of canyon rock splits off, exposing you on the fresh cliff face.
People find the ridge. It becomes a barrier, and a meeting point. They carve footholds in the steep western face. At the top, they paint the rock. In the 13th century, drought strikes, conflict waxes. People build houses along your cliff, for defense and concealment.
All of these versions of “ancient” come together at Comb Ridge. On an usually warm, calm day in November, I hiked up one of its canyons, reaching a vista point at the rim where petroglyphs decorate the sandstone walls. In the valley to the west, the tectonic event that built Monument Upwarp raised older layers from the Permian and Triassic Periods. Despite this, the land itself forms a valley: the result of erosion hollowing out the soft rocks, leaving the younger and tougher sandstones to form a jagged ridge.
At this point I should confess something: I’m a geomorphologist. That’s the branch of science that deals with landforms and their changes in time, whether they be swift or slow. So on the long ride home I couldn’t help pondering Comb Ridge. Fortunately, my traveling companion likes to drive, so I was free to explore, via laptop and computer code, how the ridge formed. The image below illustrates a simulation of one possibility (see also this animation).
The story starts with three buried layers, one representing the hard Wingate, Kayenta, and Navajo sandstones that make up the ridge; one for the soft Triassic age sediments below them; and one for the soft Jurassic age sediments above. When the simulation begin, they have already been bent into a stretched-out and curvy Z-shape, [1] somewhat like this:
‘ ‘ ‘ \ , , ,
In other words, you (as the sand grain) have already been long buried, and the rocks around you already bent by tectonics, by the time our simulation starts. To represent regional erosion, the right-hand edges of the domain gradually lowers, as if cut by a large river just out of view. Digital water rains across the gridded terrain, following the easiest path downhill and eroding the land as it goes. The uplifted part of the hard layer gets exposed first, forming a high plateau drained by eastward-flowing streams. The streams break through into the soft layers below and the plateau’s cap is gradually worn away, leaving only the kinked part, which juts up from below at a steep angle. For a while, the east-flowing streams cut canyons through this hard layer. Then, one by one, they are captured, leaving behind a row of wind gaps along the ridge: the cavities between the teeth of the comb. Despite its simplifications and abstractions, the simulation seems to capture the essence of how Comb Ridge might have formed.
Simulations like this allow us to compress time, to speed up weather and water and wear to something that can fit inside a human mind. Still, a visit to a landform like Comb Ridge—a place that was ancient before the ancients arrived—provides a delicious reminder of the spaciousness of time.
Notes and acknowledgments
[1] In case you’re curious, I made this shape with a hyberbolic tangent function.
Thank you to Alex and Judy for introducing me to Comb Ridge.
To subscribe to Greg Tucker's newsletter series, visit https://earthcastings.ghost.io
This blog was originally posted at: https://earthcastings.ghost.io/comb-ridge-story-of-a-landform


The groundwork for modern weather and climate modeling was laid by a British meteorologist named Lewis Fry Richardson (1881–1953). I had been dimly aware of Richardson’s work, and had (rather unfairly) imagined him as a brilliant but arrogant fellow, perhaps contemptuous of those whose mathematical rigor fell short of his own. But when I looked more deeply into Richardson’s life and times, I discovered that I couldn’t have been more wrong.
Born to a Quaker family in Durham, England, Lewis Richardson's interest in science led him first to Durham College of Science and later to Kings College Cambridge, where he graduated in 1903. Leaving Cambridge, Richardson alternated between positions in academia and industry. When World War I broke out, he was working for the British Meteorological Office, overseeing a weather observatory in Scotland. As a Quaker and a pacifist, Richardson declared himself a conscientious objector. In lieu of military service, he joined the Friends' Ambulance Unit, and spent the war years conveying wounded men rearward from the front lines. Returning to England after the armistice, Richardson found that his status as a conscientious objector effectively shut him out of university jobs. After briefly rejoining the Meteorological Office—he resigned again in 1919 when the Office was placed under the control of the Air Ministry—Richardson found work as head of the physics department at Westminster Training College, a teacher-education institution in London.

Then disaster struck. During the Battle of Champaign the manuscript was sent to the rear, where it vanished.
Luckily, as Richardson would recall, the lost manuscript was “rediscovered some months later under a heap of coal”. Four years after the war’s end, Richardson published his work under the title Weather Prediction by Numerical Process (Richardson, 1922). In one of the most remarkable passages, he wrote:
- ... may one play with a fantasy? Imagine a large hall like a theatre, except that the circles and galleries go right round through the space usually occupied by the stage. The walls of this chamber are painted to form a map of the globe. The ceiling represents the north polar regions, England is in the gallery, the tropics in the upper circle, Australia on the dress circle and the antarctic in the pit. A myriad of computers are at work upon the weather of the part of the map where each sits, but each computer attends only to one equation or part of an equation. ... From the floor of the pit a tall pillar rises to half the height of the hall. It carries a large pulpit on its top. In this sits the man in charge of the whole theatre ... he is like the conductor of an orchestra in which the instruments are slide-rules and calculating machines. But instead of waving a baton he turns a beam of rosy light upon any region that is running ahead of the rest, and a beam of blue light upon those who are behindhand.
The subject of all these calculations, of course, was the weather. The computers sitting in the chairs of this imaginary theatre, performing calculations and exchanging data, were not machines but people. In 1922, the word “computer” meant a job description: a person equipped with pencil, paper, and slide rule. In a sense, Richardson was describing the world’s first data center—one fed not by electricity but by tea and biscuits.

In the years following the publication of Weather Prediction by Numerical Process, Lewis Richardson turned his creative energy toward a variety of other topics. He is known, for example, as an early pioneer in what we now call fractal geometry, famously observing that the length of the coastline of Britain depends on the size of ruler one uses to measure it. He produced major works on the scientific analysis of war and conflict. And he was interested in the phenomenon of turbulence: the tendency of a fast-moving flow to break up into random-seeming eddies and whorls, which gives us babbling brooks and rattling airplanes.
When I cover the subject of turbulence in my geofluids course, I like to open with a poem that Richardson composed:
Big whorls have little whorls
Which feed on their velocity,
And little whorls have lesser whorls
And so on to viscosity.
(See: Richardson’s turbulence ditty.... reference below)
From little whorls to playful fantasies, the work of Lewis Fry Richardson—scholar, pacifist, and visionary—is a lovely reminder of how science, at its best, thrives on wonder and imagination.
References and further reading
- Richardson, L. F. (1922). Weather prediction by numerical process. Franklin Classics.
- Richardson’s turbulence ditty was inspired by the mathematician Augustus De Morgan (1806–1871), whose poem Siphonaptera included the lines
Great fleas have little fleas upon their backs to bite 'em,
And little fleas have lesser fleas, and so ad infinitum.
De Morgan’s poem derived in turn from a section of Jonathan Swift’s 1733 On Poetry: A Rhapsody:
So, Nat’ralists observe, a Flea
Hath smaller Fleas that on him prey,
And these have smaller yet to bite 'em,
And so proceed ad infinitum:
History does not record whether Swift’s lines themselves derived from some prior work, which came from yet an earlier one, and so on down through deep time.
To subscribe to Greg Tucker's newsletter series, visit https://earthcastings.ghost.io
This blog was originally posted at: https://earthcastings.ghost.io/pathways/

In a 20-minute whirlwind, I shared some of my favorite discoveries about earth’s distant past, concluding with a look at ice cores (https://science.nasa.gov/science-research/earth-science/climate-science/core-questions-an-introduction-to-ice-cores/?ref=earthcastings.ghost.io) and the Keeling Curve (https://keelingcurve.ucsd.edu/?ref=earthcastings.ghost.io). Then the hands shot up. How do scientists get gas samples out of the ice cores? If geologists can reconstruct past continents, can they project future continents too? How does the moon influence the earth? How has the unfolding of climate change affected the way earth scientists work?
After the class was dismissed, a knot of kids stayed on to ask yet more questions. A few even trailed me to the school doors. It is sometimes said that this generation’s attention span has been stunted by smart phones, but if so, I saw no sign of it in their eager curiosity.
As I left the school, it dawned on me that these kids will be in their late 80s in the year 2100. That particular year holds a special place in the annals of earth science. Since the very first report by the Intergovernmental Panel on Climate Change (IPCC) in the early 1990s, the year 2100 has been the target date for long-term projections of climate change. When today’s middle schoolers are octogenarians, they will learn the answer to the riddle of our times: what will planet earth look like in the year 2100?
In their most recent report (https://www.ipcc.ch/assessment-report/ar6/?ref=earthcastings.ghost.io), IPCC looked at five scenarios for the remainder of the century. Known as Shared Socioeconomic Pathways (https://en.wikipedia.org/wiki/Shared_Socioeconomic_Pathways?ref=earthcastings.ghost.io; SSPs), these scenarios describe alternative visions of the future that today’s middle schoolers might end up witnessing. Two scenarios in particular stand out as plausible endpoints on a spectrum of possibility: the Rocky Road, and the Green Road.
The Rocky Road scenario (known technically as SSP3-7.0, or “Regional Rivalry”) represents a world in which “a resurgent nationalism, concerns about competitiveness and security, and regional conflicts push countries to increasingly focus on domestic or, at most, regional issues. … Economic development is slow, consumption is material-intensive, and inequalities persist or worsen over time” (O’Neill et al., 2017). In this grim vision, by the year 2100 our now-octogenarian kids are sharing the planet with over twelve billion others. They are doing their best to survive in a world that averages 6 to 7 oF hotter (+3.6 oC) than it was in pre-industrial times. Carbon dioxide in the atmosphere has doubled since the 2020s, to a level last seen on earth millions of years ago—long before the existence of anything resembling Homo sapiens. The seas are nearly three feet higher and still rising; coastlines are littered with the wave-bashed remains of former cities and towns. The now-elderly middle schoolers look back to a time when diseases like dengue fever and malaria were virtually unheard of in North America, when food and other goods were affordable and abundant, when droughts, floods, and fires were not nearly so common. They look back to a time before killer heat waves, which have now become routine tragedies in the warmer parts of the world.
Fortunately, this grim path is not set in stone. A more cheerful alternative is SSP1-2.6: The Green Road. In this scenario, “the world shifts gradually, but extensively, toward a more sustainable path, emphasizing more inclusive development that respects predicted environmental boundaries” (O’Neill et al., 2017). By 2100, the kids who came of age back in the 2020s now share the planet with a stable population of about 7 billion, a bit less than today. Human prosperity is now powered by what the writer Bill McKibben calls “energy from heaven, not energy from hell”. Around the year 2070, the world reached a major milestone: net zero carbon emissions. The climate system responded. Earth of the year 2100 averages about three oF warmer (1.8 oC) than it was in the days of Abraham Lincoln: a bit hotter than the 2020s, but a far cry from the nightmare of the Rocky Road. Sea level has risen by a couple of feet. Glaciers are still melting, and the wild weather of the early 21st century persists. But overall the news is good: smart policy choices, propelled by a combination of activism and an increasingly competitive market for renewable energy, have steered the planet away from catastrophe. The climate is on course back toward the cooler, calmer world that prevailed through most of recorded history. The now-elderly middle schoolers look back with pride on what their generation has achieved.
There’s plenty of debate about the plausibility and likelihood of these and other scenarios (e.g., Hausfather & Peters, 2020). Some would no doubt argue, for example, that the entrance to the Green Road is already receding. On the other hand, even as greenhouse gas emissions continue to rise (https://www.carbonbrief.org/analysis-global-co2-emissions-will-reach-new-high-in-2024-despite-slower-growth/?ref=earthcastings.ghost.io), the costs of renewable energy (https://www.nytimes.com/2025/10/07/climate/renewable-energy-growth-globally.html?ref=earthcastings.ghost.io) have plunged faster than even the most optimistic analysts predicted (Creutzig et al., 2017; McKibben, 2025). The future is not yet written, and it remains ours to write.
What kind of planet will today’s middle school kids inherit? What pathways will the world follow? Much depends on policy choices now and in the near future. Those in turn depend on the public’s attitude toward scientific understanding. On that score, recent trends in the United States don’t offer much encouragement. But those trends don’t jibe with what I saw on my visit to the school that day. To the contrary, the lively curiosity and imagination of the kids I met last month gives me hope that the next generation is already rising to the challenge.
References and further reading
- Creutzig, F., Agoston, P., Goldschmidt, J. C., Luderer, G., Nemet, G., & Pietzcker, R. C. (2017). The underestimated potential of solar energy to mitigate climate change. Nature Energy, 2(9), 1-9.
- Hausfather, Z., & Peters, G. P. (2020). Emissions–the ‘business as usual’ story is misleading. Nature, 577(7792), 618-620.
- Masson-Delmotte, V., Zhai, P., Pirani, A., Connors, S. L., Péan, C., Berger, S., ... & Zhou, B. (2021). Climate change 2021: the physical science basis. Contribution of working group I to the sixth assessment report of the intergovernmental panel on climate change, 2(1), 2391.
- McKibben, B. (2025) Here Comes the Sun: A Last Chance for the Climate and a Fresh Chance for Civilization. Norton.
- Meinshausen, M., Nicholls, Z. R., Lewis, J., Gidden, M. J., Vogel, E., Freund, M., ... & Wang, R. H. (2020). The shared socio-economic pathway (SSP) greenhouse gas concentrations and their extensions to 2500. Geoscientific Model Development, 13(8), 3571-3605.
- O’Neill, B. C., Kriegler, E., Ebi, K. L., Kemp-Benedict, E., Riahi, K., Rothman, D. S., ... & Solecki, W. (2017). The roads ahead: Narratives for shared socioeconomic pathways describing world futures in the 21st century. Global environmental change, 42, 169-180.
- Robinson, K.S. (2020) The Ministry for the Future. Orbit Books.
To subscribe to Greg Tucker's newsletter series, visit https://earthcastings.ghost.io
This blog was originally posted at: https://earthcastings.ghost.io/pathways/

So I was excited to visit the town of Seneca Falls, New York. The town hugs the Seneca River, which drains (you guessed it) Seneca Lake. Unfortunately I was a century or so too late. The falls were once a series of natural rapids that dropped the river down about 40 feet. By 1915, canal builders had entombed the cascade in a dam-and-lock complex, which now impounds a water body called Van Cleef Lake. For the time being, Seneca’s rocky wave has been arrested in concrete.
Fortunately, Seneca Falls has other delights to offer. I first heard of the place while reading about the life and times of Eunice Newton Foote, who lived there in the mid 1800s. Foote was, among other things, an inventor and a scientist. She had multiple patents to her name: a thermostatically controlled stove (1842), a shoe and boot insert of vulcanized rubber (1860), a paper-making machine (1864), a strapless skate (1868). My interest, though, was in her contribution to earth science. In 1856 Eunice Newton Foote conducted experiments on the absorption of sunlight by various gases. Among her subjects was carbonic acid gas, nowadays known as carbon dioxide or CO2. Foote found that CO2 absorbs radiant energy. Because of the nature of her apparatus—gas-filled glass jars exposed to sunlight—Foote was not able to identify the underlying mechanism (five years later, experiments by John Tyndall in Britain revealed that CO2 strongly absorbs infrared radiation). But she was farsighted enough to understand the implications of her findings. “An atmosphere of that gas,” she wrote, “would give to our earth a high temperature; and if as some suppose, at one period of its history the air had mixed with it a larger proportion than at present, an increased temperature … must have necessarily resulted.” In other words, Eunice Newton Foote was the first person to recognize the powerful role that CO2 plays in controlling earth’s surface temperature.
Not that she got much credit for it at the time. Her results were presented at the 1856 meeting of the American Association for the Advancement of Science, but not by Eunice Foote. Instead, a gentleman named Joseph Henry presented on Foote’s behalf. Henry remarked to the audience that “Science was of no country and of no sex. The sphere of woman embraces not only the beautiful and the useful, but the true.” History does not record whether Foote was present, and if so, whether she cringed at this. In any case, her brief published report seems to have been ignored for the next century or so, overshadowed by Tyndall’s more sophisticated experiments.
Meanwhile, Eunice Newton Foote must have been busy. Among other things, Seneca Falls in the mid-1800s was the epicenter of the American women’s rights movement, and Foote was in the thick of it. She was closely involved in the first-ever conference dedicated women’s rights: the Seneca Falls Convention, held in July 1848 at the town’s Wesleyan Methodist Chapel. Today, in honor of that event, Seneca Falls is home to the Women’s Rights National Historical Park.
I arrived in Seneca Falls on a hot July day and parked on the main street. Across the road was a row of tents, of the sort you see at craft fairs and farmers markets. A large banner on one tent read “Feminist Lemonade.” I walked two blocks toward the National Historical Park, where a Visitors Center stands next to the Chapel. A crowd was gathered around the Chapel entrance, including a group of girl scouts who giggled as they tried to wedge themselves into a tiny patch of shade from a sidewalk tree. By sheer dumb luck, I had arrived at the exact day, time, and place of the annual commemoration of the Seneca Convention.
The chapel doors opened, and Elizabeth Cady Stanton herself (or rather, an actress portraying Stanton) emerged to greet us and usher us into the chapel. Someone mentioned that the actress was actually Stanton’s great-great-granddaughter. Elizabeth Cady Stanton was assisted by none other than Frederick Douglass, with his memorable shock of curly gray hair. We filed into the refreshingly cool and austere space, and took seats on the wooden pews. Above us, where the chapel’s upper gallery had once existed, hanging paintings depicted the gallery as it might have appeared on those two days in 1848: women, men, and children in 1840s garb; some scowling, some thrilled, some quietly curious.
Frederick Douglass stood to welcome us and declare his enthusiastic support for the cause, just as the real Frederick Douglass had done at the Convention. Then Stanton took the lectern, and read from the Convention’s Declaration of Sentiments:
“When, in the course of human events, it becomes necessary for one portion of the family of man to assume among the people of the earth a position different from that which they have hitherto occupied, but one to which the laws of nature and of nature's God entitle them, a decent respect to the opinions of mankind requires that they should declare the causes that impel them to such a course.”
The Declaration concluded with a note of determination:
“In entering upon the great work before us, we anticipate no small amount of misconception, misrepresentation, and ridicule; but we shall use every instrumentality within our power to effect our object. We shall employ agents, circulate tracts, petition the State and national Legislatures, and endeavor to enlist the pulpit and the press in our behalf. We hope this Convention will be followed by a series of Conventions, embracing every part of the country.”
The written declaration has a long list of signatures. Eunice Newton Foote’s appears near the top, just below Stanton’s name.
Eunice died in 1888, more than three decades before ratification of the 19th amendment. What if she had been able to time-travel, Lazarus-like, through the 20th century and into the 21st? What would she make of today’s world? Undoubtedly she’d be pleased to see progress on human rights; probably she’d be disappointed at the slow pace. And what of her hunch about carbonic acid gas? I imagine Eunice being thrilled to learn that her intuition was spot on, that in fact the absorption of radiant energy by CO2 now forms a central pillar of climate science.
And what would she make of modern efforts to discredit climate science? I imagine her smiling ruefully and remarking, in her mid-19th century dialect, that she’s seen plenty of that sort of thing before.
A load of cement can bury a waterfall, stalling its progress for a while. But the river's power persists, and in the long run, waterfalls break through.
To subscribe to Greg Tucker's newsletter series, visit https://earthcastings.ghost.io
This blog was originally posted at: https://earthcastings.ghost.io/the-wizard-of-seneca-falls

Last May, the Montclair, NJ, setting for the CSDMS Annual Meeting gave me the opportunity to spend time in northern New Jersey, not far from where I grew up (Figure 1). The occasion reminded me that New Jersey is much more than a crowded suburban outgrowth of New York and Philadelphia. Under the tapestry of streets and towns, New Jersey turns out to be a fascinating geologic nexus.


Today, sedimentary rocks of the Newark Basin, shown by green and teal colors in Figure 4, underlie most of northern New Jersey, and extend into southeastern Pennsylvania. The western border fault of the graben, called the Ramapo Fault, marks the boundary between the basin and the northern New Jersey highlands. Inside the Newark Basin, layers of sediment mark out rhythms as if marching to the slow beat of some cosmic conductor. These are understood to be tuned to so-called Milankovitch Frequencies: cyclic variations in the earth’s spin axis and in the eccentricity of its orbit. (Why these frequencies show up in sediments throughout the Mesozoic Era, and especially during the mid-Cretaceous hothouse when there is thought to be relatively little ice at the poles to enable sea-level variations, remains something of a mystery; one idea is “aquifer eustasy.”2)
The Newark Basin sediments span the Triassic-Jurassic boundary, roughly 200 million years ago, which marks one of the Big Five mass extinctions. The cause is uncertain but one likely suspect is a massive outpouring of volcanism that spewed out the region in and around the seams of the opening Atlantic. Known as the Central Atlantic Magmatic Province, or CAMP for short, it’s the largest known Large Igneous Province.
CAMP shows up in New Jersey, where it spewed out a series of volcanic flows that oozed across the subsiding Newark Basin. These layers of lava, and the sediments above and below, continued to sink and tilt as the rift block slipped. If you were to take a pancake, slice it in half down the middle and remove the left half, then place the remaining right half across a bowl with the round side across the rim and the cut side drooping down into the bowl, you’d have a rough approximation of how basin subsidence warped the Newark Basin lava flows, tilting the cut (fault-bounded) edge down in the middle and the remaining edges upward. Subsequent uplift and erosion shaped the exposed flows’ edges into the odd ring-like ridges of the Watchung Mountains (orange in Figure 3 and red in Figure 4). The pulse of CAMP volcanism that produced these basalt flows also injected magma between sedimentary layers underground, creating the diabase of the Palisades Sill (pink in Figure 4). Exposed by erosion in the Hudson valley, these dark black rocks now form steep cliffs along the west side of the Hudson River3.
The sediments draping the southern half of the state are much younger than those of the Newark Basin, ranging from Cretaceous to late Cenozoic. They were deposited along the newly formed coastline as the Atlantic continued to widen. In central southern New Jersey, well-drained and nutrient-poor coastal plain sands (yellow in Figure 4) support the open forest of dwarf pine trees that make up the Pine Barrens.
Over the last two million years, repeated ice ages have gripped planet earth. During the most recent glaciation, which peaked roughly 20,000 years ago, the ice sheet reached north-central New Jersey. The ice blocked the Passaic River, forming a large proglacial lake known as Lake Passaic (Figure 5). At its height, Lake Passaic filled the whole area inside of the north Jersey’s basalt rings like a giant bathtub. The advancing ice front built a complex of moraines that blocked the Passaic’s original escape route across the basalt ridges of the Watchung Mountains. As the ice retreated, the Passaic found a new course further north, creating a dramatic waterfall across the basalt.
At the time European colonists first arrived in North America, the Passaic River basin was home to the Acquackanonk people, a Lenape group. In the late 17th century, Dutch traders “settled” the land (more likely, seized it by force from the Lenape). By the 18th century, English colonists had succeeded the Dutch in the Passaic watershed, and the cascade acquired the English name Great Falls.

New Jersey’s rich geologic legacy shapes its present in countless other ways too, from the dynamic barrier islands of the sandy coast to the mineral-rich ancient Appalachian highlands. Ecosystems, resources, transportation, water courses, soils: all of these reflect hundreds of millions of years of geologic evolution. It’s a reminder that even the most densely populated and urbanized spaces are painted onto a dynamic surface with a deep geologic history and trajectory, becoming just the latest chapter in the landscape’s long-running story.
1) Mitchell, R. N., & Kirscher, U. (2023). Mid-Proterozoic day length stalled by tidal resonance. Nature Geoscience, 16(7), 567-569.
2) See, e.g., Sames et al. (2020) Aquifer-eustasy as the main driver of short-term sea-level fluctuations during Cretaceous hothouse climate phases. https://doi.org/10.1144/SP498-2019-105
3) Thanks to Mike Steckler for pointing out to me the connection between Newark Basin volcanism and the CAMP.
4) Thereby demonstrating that people have cared about both stream power and awkward acronyms for a long time.
(This essay was originally delivered as an address to the 2021-22 academic year Geological Sciences graduates at the University of Colorado Boulder)
The late cosmologist Carl Sagan described science as “more than a body of knowledge: it’s a way of thinking, a way of skeptically interrogating the universe” (Carl Sagan, 1996). In the case of Earth science, Sagan might have added that this way of thinking, this method of interrogating the universe, has revealed some truly incredible stories of our planet’s past, its present, and what might be its future. Each rising generation of Earth and environmental scientists joins the field as custodians both of the stories themselves and of the methods that continue to reveal and refine them.

.png)


On a human planet, the skills of the geoscientist are needed more than ever. I offer three wishes for today’s generation of graduates in the geosciences. The first is that whatever professional paths you may follow—and there are plenty of pathways both within and beyond the sciences that need your skills and knowledge—that you bring Earth science with you. Bring the perspective of deep time. Bring the perspective of dynamically interacting physics, chemistry, biology—and sometimes humans too. Bring the perspective of asking, as Bertrand Russell put it: “what are the facts, and what is the truth that the facts bear out?” (Bertrand Russell, 1959).
The second wish is about the incredible geo-stories that science has unearthed. I hope today’s newly minted custodians of Earth’s stories will share them widely. Of course, it doesn’t hurt to keep one eye out for the occasional yawn or glance at a watch—but still, these incredible stories are worth knowing and worth telling.
My final wish is about nature. When I first got into geoscience I worried a bit that learning about its technical minutia might diminish the mystery. But I found exactly the opposite: the more I learn, the more I appreciate how truly amazing this planet is. I hope you find the same thing, and that what you have learned and continue learn about the Earth deepens your love affair with this incredible, beautiful, miraculous planet we call home.
References
- Carl Sagan interview with Charlie Rose, PBS, 27 May 1996 (transcript available at https://speakola.com/ideas/carl-sagan-science-last-interview-1996).
- Bertrand Russell, 1959 “Face to Face” interview with John Freeman, BBC.
- The global CO2 level is over 420 ppm as of northern hemisphere spring 2022. See https://www.co2.earth/.
- Sampson, S.D., Loewen, M.A., Farke, A.A., Roberts, E.M., Forster, C.A., Smith, J.A., Titus, A.L., 2010. New Horned Dinosaurs from Utah Provide Evidence for Intracontinental Dinosaur Endemism. Plos One, 10.1371/journal.pone.0012292.
- Femke Nijsse, 2018. Carbon Dioxide 800kyr. See also: https://commons.wikimedia.org/w/index.php?curid=69480542
- USGS, 2005. Public domain. See also: https://commons.wikimedia.org/w/index.php?curid=183796
- Wilson, M.A., 2008. Holocene cinder cone (https://en.wikipedia.org/wiki/Cinder_cone) volcano on State Highway 18 (https://en.wikipedia.org/wiki/State_Highway_18) near Veyo, Utah (https://en.wikipedia.org/wiki/Veyo,_Utah). See also: https://commons.wikimedia.org/w/index.php?curid=4488876
- Paubahi, 2012. Artists’ conception of Messinian Mediterranean basin. See also: https://commons.wikimedia.org/wiki/User:Paubahi#/media/File:Messinian_salinity_crisis_5.96_mya_stage_-_drying.jpg
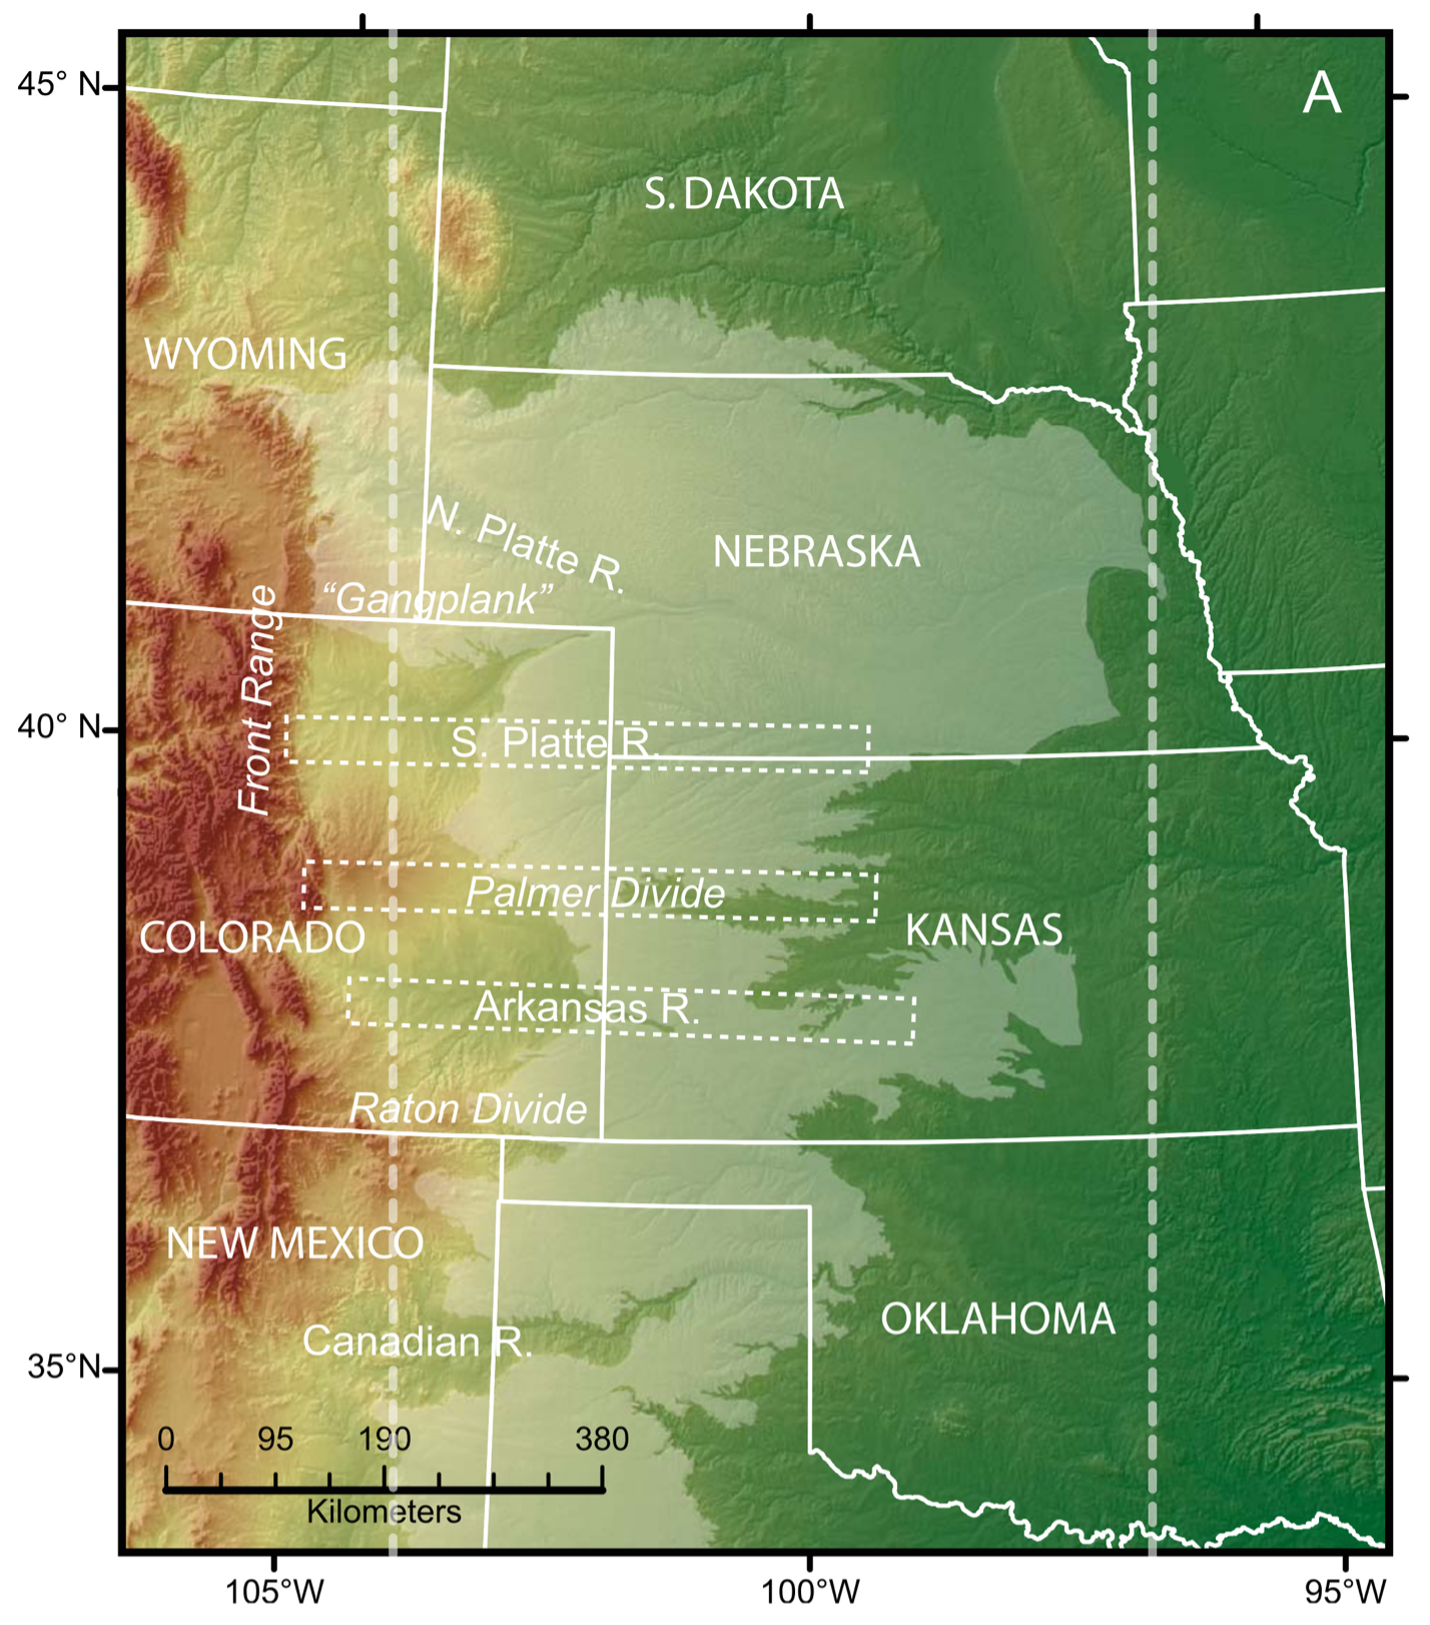
The central United States contains one of the longest hills in the world. Start off in Davenport, Iowa, where route 80—the highway connecting New York and San Francisco—crosses the Mississippi River. The river here sits about 170 m above sea level. As you drive west on an 800-mile journey toward the Rocky Mountains, the land steadily rises. Des Moines, Iowa, 250 m. Omaha, Nebraska, 360 m. Ogallala, Nebraska 980 m. Kimball, Nebraska, 1,440 m. Cheyenne, Wyoming, 1,850 m, and finally, another 20 miles west past Cheyenne takes you to the first dark, crystalline rocks of the Rockies, at 2,200 m above sea level. Not for nothing are the lands east of the Rockies known as the High Plains.
The last 450 miles of your journey—since passing through Seward, Nebraska—have carried you across the Ogallala Group. The name sounds like a midwestern insurance agency, but in fact it belongs to a geologic unit: a thin but widespread deposit of sand and gravel left behind by east-flowing streams between about 12 to 6 million years ago. What the Ogallala lacks in thickness (no more than a few hundred meters in most places), it makes up in spatial extent. The deposits drape across eight states, from Texas to South Dakota, spanning 11 degrees of latitude and covering an area of 450 thousand square kilometers (Figure 1). Pick a point at random in the lower 48 and you have a 1 in 20 chance of landing on the Ogallala Group.
The Ogallala’s fame comes from its water. The tiny but well-connected gaps between the grains of sand and gravel, known as pores, collectively hold a Great Lake’s worth of fresh water. Since the invention of central-pivot irrigation in the 1950s, mining that underground water source has made a breadbasket of the semi-desert (though perhaps not for much longer; for more on that, see William Ashworth’s wonderful book Ogallala Blue).
Where did the Ogallala come from? At one level, the answer is simple: its sediments were deposited mainly by east-flowing streams rising in the Rocky Mountains, over a period of several million years during the middle to late Miocene period. Understanding why is harder. Normally, sediments accumulate in places where the Earth has created space to hold it. The Mississippi River unloads its dirt in the Gulf of Mexico. The powerful rivers draining the Himalayas leave some of theirs in the Ganges and Brahmaputra valleys before dropping the rest in the Bay of Bengal. Geologists call these deep (Bay of Bengal, Gulf of Mexico) or sinking (Ganges valley, Mississippi delta) places sedimentary basins, and speak in terms of their accommodation space: the volume available to catch and hold sediment.
But in the case of the Ogallala, there’s no vacancy—at least, not much. The region is not today, and was not in the Miocene, a deep ocean basin. We know this from a combination of clues: mammal bone fossils, river sediments, ancient buried soils. Clearly the Ogallala formed entirely on land. Nor do the Ogallala sediments sit in a sedimentary basin, at least not in the usual sense. A sedimentary basin can form where the weight of an adjacent growing mountain range pushes down the surrounding crust, creating a depression known as a foreland basin (imagine a person sitting on a trampoline: their weight bends down the surface of the mat around them). Basins can also form where tectonic stretching splits the crust into county-sized slivers, some of which sink relative to the others, creating long narrow basins separated by mountain ranges. That stretching process has created the iconic basin-and-range landscape that spans from eastern California to central Utah. But there’s no evidence that any of these things were happening in the central plains at the time those Miocene rivers were spreading their sands across the continent.
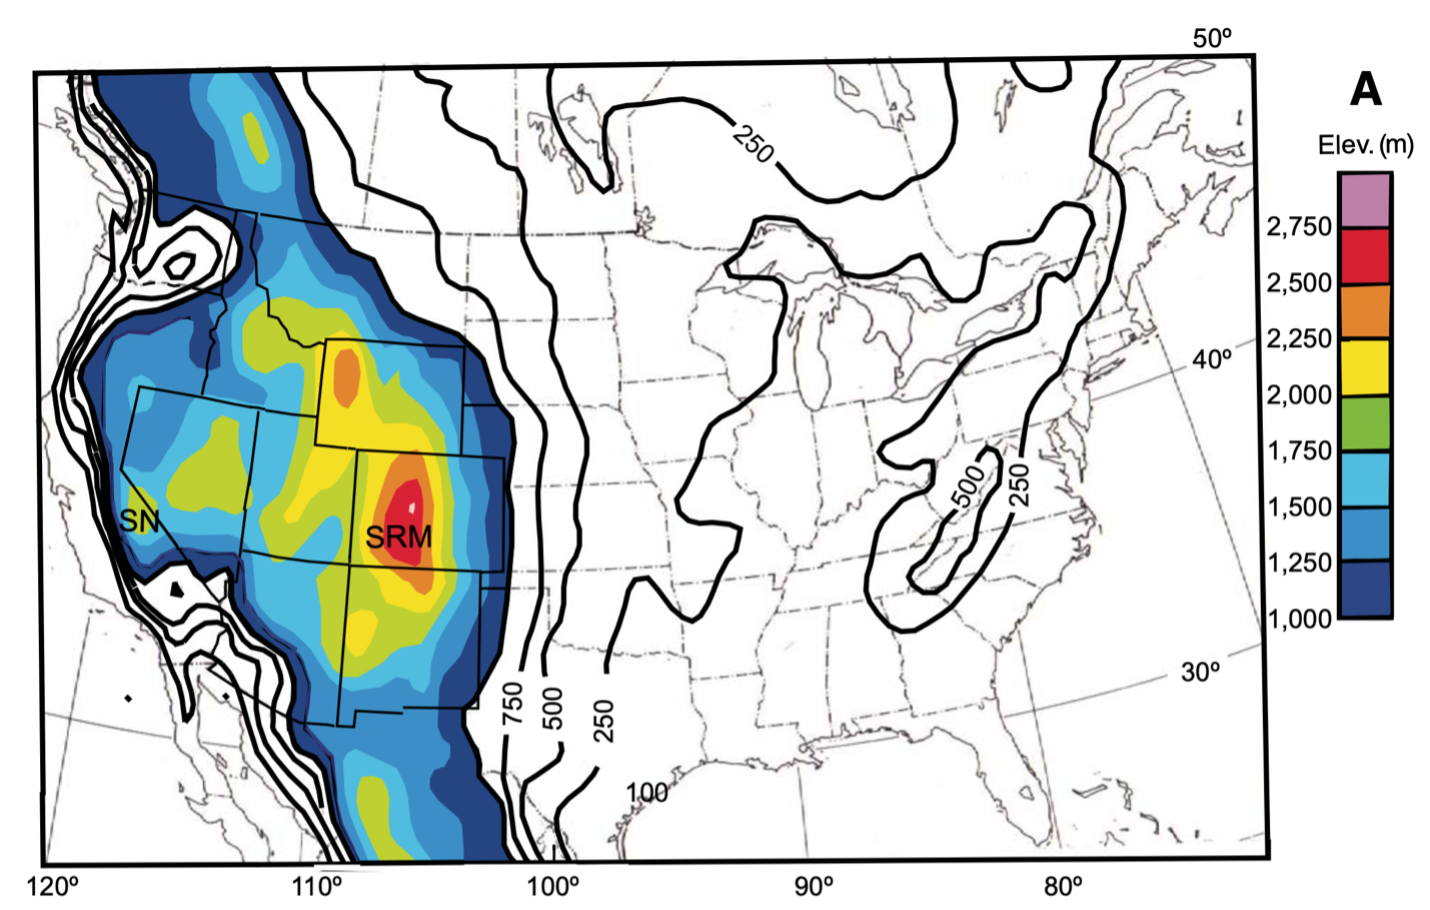
The region encompassing the High Plains, southern Rockies, and Colorado Plateau forms a nation-sized swell across the western United States. Gordon Eaton, who served as the 12th Director of the US Geological Survey, pointed out in a 2008 article that when you average over the peaks and valleys, the region around the southern Rockies forms the highest terrain by far in North America: a mile-high, nation-sized bump in the continent that Eaton called the “Southern Rocky Mountain Epeirogen” (Figure 2; Eaton, 2008). Geologists continue to debate the basic question of when this swell first became swollen. Multiple clues suggest the region has been elevated to some degree for the last 40 million years. Some argue that the region kept on rising progressively since that time; others, that the swell accomplished most of its growth early on. Regardless, there’s a general consensus that high elevations have existed in this region for millions of years, and beyond the sediments themselves, there is no evidence for widespread sinking of the western plains. But high elevation regions tend to erode, as gravity relentlessly moves material down slopes. So why the Ogallala? Why do we have deposits from a time and region that ought to have been slowly eroding?
The literature does not lack for speculation. Charles Chapin, New Mexico State Geologist emeritus, suggested in 2008 that “…the changing climate had become so arid by 12 [million years ago] that there was no longer adequate stream flow to carry erosional detritus from the region” (Chapin, 2008). In other words, the rivers ran out of water, and had to drop their loads on the plains. But where then was the water to mobilize the debris in the mountains? Jon Pelletier of the University of Arizona offered an alternative idea: as the climate cooled, more snow accumulated in the mountains, and its meltwater provided the energy for enhanced erosion. He noted that the “erosion would have triggered widespread deposition downstream from those [river] basins, which is broadly consistent with the magnitude, timing, and spatial distribution of the Ogallala Formation” (Pelletier, 2009). A potential objection is that melting snow tends to pack less erosive power than rainstorms, because the landscape releases its water gradually rather than in an abrupt punch. Still, if a cooler climate also brought more total water to the mountains, the net effect could increase erosion there, and deposition downstream. A related concept involves thermal effects: when the temperature falls near or a bit below freezing, growing ice in the ground can shatter rock, and the alternate swell and collapse of soil provides an efficient conveyor belt to carry the remnants downhill. Jill Marshall of the University of Arkansas showed in a recent paper that this process of “frost cracking” would have been surprisingly extensive across the western US during the last ice age, and presumably in prior ice ages as well (Marshall et al., 2021). Perhaps then the cooling of the high country provided the debris and the water, while the drying of the plains starved rivers of the flow needed to carry it all the way to the Mississippi.
If the Ogallala’s birth presents one mystery, its demise offers another. The age of its youngest deposits seems to fall somewhere between 7 million years (to the south) and 5 million years (to the north). The shape of the unit in map view hints strongly that the deposits once covered an even larger area (Figure 1). In parts of the Front Range, geologists have identified patches of rounded river gravel of unknown age that might represent a time when the Ogallala sediments stretched up some of the major valleys in the mountains. To the east, across Nebraska, Kansas, Oklahoma, and Texas, finger-like valleys where the unit is absent suggest that rivers have cut through it. To the west, the Ogallala stretches all the way to the Rockies in only one place: a tongue-like peninsula known as the “Gangplank” that stretches across western Nebraska and southeast Wyoming to meet the Front Range (and incidentally, provides a conveniently gentle ramp for the railroad and interstate route 80). Elsewhere, the sediments appear to have been carved away by the major rivers draining the Front Range, including (from north to south) the North Platte, South Platte, Arkansas, and Canadian. Apparently, several million years ago, the rivers switched from draping the plains in sediment, to carving away at their former deposits, eating at them simultaneously from upstream and downstream, leaving the middle intact (Figure 1). Along the way, in cutting into the soft sediments along the mountains’ edge, they stimulated the carving of deep canyons in the hard rocks along the fringes of the Colorado Front Range: Cache La Poudre, Big Thompson, St. Vrain, Boulder, Clear, and so on southward.
Why? The two most obvious culprits are tectonics and climate. Rocky Mountain geologists had long inferred, based on the Ogallala’s demise and the rejuvenation of canyons, that the Rockies rose again during the last several million years. But if so, the range grew without creating the expected faults up which a growing mountain range would normally climb. Furthermore, several clues—from fossil leaves to “clumped” isotopes to bubbles in ancient lava flows—imply that the region gained at least some of its famous altitude long before the rivers abandoned the Ogallala sediments. Still, other clues point to tectonic unease in the western High Plains. For example, a study of ancient river channels by University of Arkansas geologist Beth McMillan and colleagues revealed that the Ogallala deposits on Wyoming’s Gangplank have been tilted up to the west since they were first laid down (McMillan et al., 2002): more so than can be accounted for by the expected natural rebound of the crust as erosion gradually lightens its load (Leonard, 2002). Perhaps, then, broad regional uplift and tilting lent the rivers extra transport power, which led them to carve today’s valleys in the westernmost High Plains. Yet the mechanics behind this idea aren’t as obvious as they sound: a steeper region could, hypothetically, produce more sediment in its headwaters, leading to even more deposition downstream.
Climate stands among the suspects too. In a 2010 paper, Cameron Wobus and colleagues suggested, using computer simulations of an idealized High Plains river, that either an increase in water supply or a decrease in sediment supply from the mountains could drive erosion in the plains downstream, in much the same way that the clear water released below a dam tends to scour the river bed (Wobus et al., 2010). But the mechanisms to produce such changes remain speculative.
One lesson we can draw from the growth and demise of the Ogallala is how challenging it can be to predict environmental systems based on intuition alone. In the case of river networks, our intuition struggles with the delicate balance between water and sediment that dictates whether a particular channel will carve a canyon or build a deposit. Mathematical and computer simulation models provide one answer to this dilemma. They can keep precise track of all the comings and goings of water and sediment—to balance the budgets in a way our unaided human brains cannot—and thereby simulate how a river network and its landscape would evolve, given a hypothetical set of circumstances. To that end, University of Colorado geologist Vanessa Gabel recently embarked on a computer-modeling study of river network and landscape evolution in an idealized setting similar to that of the southern Rocky Mountains and adjacent High Plains. She aims to discover what circumstances of regional tectonic warping and/or climate change could produce observed erosion patterns like those experienced by the Ogallala over the past several million years.
For now, the forces that created and now have begun to destroy the Ogallala remain mysterious. By running simulation model experiments, Gabel hopes to identify what essential ingredients are needed to make and then abandon this type of thin but expansive sediment drape. By discovering these basic recipes, we can at least begin to narrow down the list of suspects.
Acknowledgements: thanks to Vanessa Gabel for perceptive comments and suggestions on this post.
References
- Ashworth, W. (2006). Ogallala Blue. WW Norton & Co.
- Chapin, C. E. (2008). Interplay of oceanographic and paleoclimate events with tectonism during middle to late Miocene sedimentation across the southwestern USA. Geosphere, 4(6), 976-991. DOI: 10.1130/GES00171.1
- Eaton, G. P. (2008). Epeirogeny in the Southern Rocky Mountains region: Evidence and origin. Geosphere, 4(5), 764-784. DOI: 10.1130/GES00149.1
- Leonard, E. M. (2002). Geomorphic and tectonic forcing of late Cenozoic warping of the Colorado piedmont. Geology, 30(7), 595-598. DOI: 10.1130/0091-7613(2002)030<0595:GATFOL>2.0.CO;2
- Marshall, J. A., Roering, J. J., Rempel, A. W., Shafer, S. L., & Bartlein, P. J. (2021). Extensive frost weathering across unglaciated North America during the Last Glacial Maximum. Geophysical Research Letters, 48(5), e2020GL090305. DOI: 10.1029/2020GL090305
- McMillan, M. E., Angevine, C. L., & Heller, P. L. (2002). Postdepositional tilt of the Miocene-Pliocene Ogallala Group on the western Great Plains: Evidence of late Cenozoic uplift of the Rocky Mountains. Geology, 30(1), 63-66. DOI: 10.1130/0091-7613(2002)030<0063:PTOTMP>2.0.CO;2
- Pelletier, J. D. (2009). The impact of snowmelt on the late Cenozoic landscape of the southern Rocky Mountains, USA. GSA today, 19(7), 4-11. DOI: 10.1130/GSATG44A.1
- Wobus, C. W., Tucker, G. E., & Anderson, R. S. (2010). Does climate change create distinctive patterns of landscape incision? Journal of Geophysical Research: Earth Surface, 115(F4). DOI: 10.1029/2009JF001562
A recent report on Justice, Equity, Diversity, and Inclusivity (JEDI) in the geosciences began like this:

But I am using the term “recent” in a geological sense, not a calendric one. The article—by Robert Gillette, discussing efforts by the US Geological Survey, Geological Society of America, and American Geological Institute to promote broader participation—was published in 1972, before a great many of today’s CSDMS members were even born (Gillette, 1972). The target time frame for achieving parity was to have been somewhere between 2002 and 2012.
Did we reach this target? Not even close. In a review of geoscience PhDs granted in the US between 1973 and 2016, Bernard and Cooperdock (2018) found that, as the title of their paper put it, there has been “no progress on diversity in 40 years” in the geosciences. As a result, the entire field has continued to miss out on an enormous pool of talent and energy.
What to do?
The American cultural and political turmoil over the past year provides yet another lesson in how deeply inequity can run in a complex society. Caste and tribalism are depressingly common facets of the human experience, and in the United States, the past year highlighted some uniquely American forms of that experience. A (calendrically) recent piece by New York Times columnist Thomas Edsall [1] describes an unfortunate characteristic of many societies: when historically marginalized groups begin to achieve greater social equality, there can be a backlash of dominant-group grievance that unscrupulous politicians are all too eager to stoke for their own gain. Such has been the American experience—both recent and historical.
But from my perspective (which is admittedly limited to that of a white male professor), I see reasons for hope, and reasons to believe that the global geoscience community can grow to become a more inclusive and diverse community. My optimism is grounded, first of all, in witnessing positive social change within my lifetime. When I was a child in the 1970s, a woman in the United States could still legally be fired simply for becoming pregnant, and prior to the 1974 Equal Opportunity Credit Act, banks could refuse to grant her credit, solely on the basis of gender. The geosciences at that time, and for many years afterward, were overwhelmingly male-dominated—meaning, among other things, that the science lost the potential contributions and talents of nearly half of humanity.
When I started graduate school in the early 1990s, my academic department of 40-some faculty included just one female (assistant) professor. But today, at the dawn of 2021, I’m proud to work in a department that boasts a 50/50 gender balance among early and mid-career faculty (the balance is currently about 40/60 female/male among all faculty). Nor is my department at CU Boulder an outlier. The silver lining in the data presented by Bernard and Cooperdock (2018) is that the geosciences have neared gender equality in the granting of PhDs (45/55 female/male as of 2016).
To be sure, as the 2020 film Picture a Scientist illustrates, women in science continue to face a host of issues that they should not have to contend with—the metaphorical body of the iceberg beneath the tip. Progress on gender equality in science can feel agonizingly, frustratingly slow. But the enormous positive change in the span of a generation demonstrates that such change is possible, and worth fighting for. Much the same can be said of LGBTQ rights: a seemingly maddening, exhausting struggle, and yet one that over the past generation or so has yielded real and meaningful progress.
One might argue that progress on women’s and LGBTQ rights does not necessarily suggest grounds for optimism when it comes to combating racism. After all, one of the striking lessons of Bernard and Cooperdock’s study is the contrast between the geosciences’ substantial progress on gender diversity, and its lack of progress on racial diversity: a finding that suggests that the challenge of equity and inclusion for BIPOC scientists is even more daunting than that of gender equity. The barriers are many; they are complex, interwoven, intersectional (e.g., Dutt, 2020). Even so, I feel a sense of cautious optimism. Over the past 30 years there have been many efforts and programs designed to improve inclusivity in science, but never before in my professional life have I witnessed anything like the energy and focus that has arisen following the public outcry over the murder of George Floyd in Minneapolis last summer. Where before there were institutional and funding agency programs, and project-level contributions encouraged by incentives like NSF’s Broader Impacts criterion, now these are joined by a sense of much wider grassroots engagement. Geoscientists are forming reading and discussion groups on JEDI issues, seeking an actionable understanding (see for example the Unlearning Racism in Geosciences project). Faculty are pressing their institutions to re-double their commitment to equitable recruitment, hiring, and retention. Not all these efforts are new, and it is important to recognize the many groups and individuals who were already working hard to build a more inclusive science community, ranging from grassroots community efforts like GeoLatinas to undergraduate engagement programs like RESESS, SOARS, and RECCS, among many. Nonetheless, I believe that the new injection of awareness and commitment that we saw in 2020 represents an important acceleration of momentum, and although it’s too soon to know where it will lead—the characteristic time scale of a professional population being measured in years or decades rather than months—I believe it is here to stay.
At the 2021 Annual (virtual) Meeting this coming May, the CSDMS community will have an opportunity to learn about practices and resources for contributing to JEDI progress. Nicole Gasparini, Chair of the CSDMS Terrestrial Working Group, will be offering a clinic on Building a More Inclusive Research Unit. In addition, community members Bec Batchelor, Anne Gold, and Diana Acero-Allard will be leading a clinic on Inclusive Mentoring. I’m grateful to all of these community volunteers for leading these events. And for those CSDMS members who have not already seen it, I highly encourage you to watch last summer’s opening lecture for the CSDMS Summer Science Series, by Dr. Brandon Jones of NSF, on Challenges and Opportunities for Increasing Participation of Underrepresented Groups in the Geosciences – highlighting, among other things, the vital importance of an “all hands on deck” approach.
In that vein, it’s worth noting another small but meaningful way that academic members of the CSDMS can contribute. Many of us are educators, and have the privilege of introducing students to the geosciences. I’m sure that a great many students have seen likenesses of James Hutton, Alfred Wegner, Henri Darcy, or Alexander von Humboldt flash by in lecture halls. Why not also include some contemporary practicing geoscientists as well? This can send an important message: geoscience is a living field, with real and (at least somewhat) diverse people who take joy in studying nature and solving problems. Along the way, it doesn’t hurt to point out the diversity in the kinds of work and career that this vast science embodies. Many people imagine geoscientists as people who roam the wilderness with a rock hammer, or sit beside oil wells and take measurements. The perception of geoscience as almost exclusively field-based, which draws so many outdoor enthusiasts to the profession, may be a source of discouragement for people from marginalized communities, who might not necessarily feel welcome or safe in all environments. Teachers in the CSDMS community are well positioned not just to bust the “cowboy geologist” myth, but also to make our students aware of the many different career paths that a background in computational geoscience in particular can support: research, environmental consulting, scientific computing, geospatial tech, and data science, to name just a few.
Carl Sagan likened science to carrying a candle in the dark (Sagan, 1995). If that flame is to endure, the call to illuminate our world with understanding must be open to everyone. Bernard and Cooperdock’s study reminds us that the task of becoming a truly inclusive scientific community is not a trivial one. But the recent history of positive social change gives reason to hope, and reason to keep working.
References
- Bernard, R. E., & Cooperdock, E. H. (2018). No progress on diversity in 40 years. Nature Geoscience, 11(5), 292-295. DOI: 10.1038/s41561-018-0116-6
- Dutt, K. (2020). Race and racism in the geosciences. Nature Geoscience, 13(1), 2-3. DOI: 10.1038/s41561-019-0519-z
- Gillette, R. (1972) Minorities in the Geosciences: Beyond the Open Door. Science, 177, 4044, pp. 148-151. DOI: 10.1126/science.177.4044.148
- Sagan, C. (1995) The Demon-Haunted World: Science as a Candle in the Dark. Random House.
The year 2020 marks the 13th birthday of the Community Surface Dynamics Modeling System. Following a series of community workshops and white papers, CSDMS (the acronym is often pronounced affectionately as “systems”) became an entity in April 2007, when NSF awarded a five-year grant led by Prof. Jaia Syvitski to establish a new facility at the University of Colorado, Boulder. The early vision expressed the ambition of a hopeful community:

Like most 13-year-olds, CSDMS has come a long way since birth, but has plenty more growth and development ahead before reaching full maturity and potential. And like a typical adolescent, CSDMS’ development has come at different speeds in different dimensions: late-blooming in some aspects, and precocious in others.
One of the surprises has been the growth of community. The makeup of CSDMS’ first executive committee gives a sense of the early disciplinary scope: sedimentary geologists, geomorphologists, and sediment-oriented oceanographers. I sat on that committee as a chair of the Terrestrial Working Group, and at the time the working groups were envisioned as just that: small teams that would actually create and manage software. But after the first few years of operation, it became clear that interest in CSDMS extended way beyond its original core of sedimentary processes. In response to the surge of interest from related communities, CSDMS established Focus Research Groups, with topics ranging from solid-earth geodynamics to ecosystems and human dimensions. Today, CSDMS has nearly 2000 members, divided among a dozen different Working and Focus Research Groups. Even the smallest group now has over 100 members, while the largest—Terrestrial, chaired by Nicole Gasparini of Tulane University and Leslie Hsu of the US Geological Survey—numbers over 900 members. The annual all-hands meetings are popular, especially with early career scientists, and full of enthusiastic buzz. The buzz remained even when the meeting was forced online by the COVID-19 pandemic: the May 2020 event had over 400 individual attendees. CSDMS may have set out to build software, but it ended up building a community.
CSDMS has also helped nurture a new culture of code sharing. When the facility first launched, model codes were mostly trade secrets: kept within lab groups and close networks of collaborators. A common attitude was that a computer model is like a lab; as Randy Leveque of the University of Washington put it, sharing code could be seen as “like inviting every scientist in the world to come use your carefully constructed lab apparatus free of charge.” But while that view has merit in some situations, Randy went on to note that there are many good reasons to share code anyway. For one thing, funding agencies require open sharing of software and data. But even if that weren’t the case, the fear of being scooped by your own software is almost always unwarranted. The reality is that no one understands your code better than you do (in fact, to create a research code that’s as accessible to outsiders as it is to its creator would be a rare and remarkable feat). And there’s no shortage of important questions that a well-crafted code can help address. In my experience, a much more common outcome from code sharing is new collaborations and contributions, as other researchers seek to build on what you’ve started.
But that wasn’t the prevailing view in the earth-surface community when the CSDMS Model Repository was first created as a platform for open sharing of version-controlled model software and metadata. The question was (to paraphrase Field of Dreams): if you built a repository, would they come? The answer turned out to be a resounding “yes”: the CSDMS Model Repository now catalogues over 370 models and tools, and continues to grow.
The same spirit of generosity took hold in the sharing of technical expertise. For the past ten years, community members have volunteered their time and energy to offer hands-on “clinics” at the CSDMS annual meetings, on topics ranging from techniques like machine-learning to the use of particular models.
Meanwhile, the vision of a comprehensive, multi-scale, and ever-improving modeling environment posed a computational challenge worthy of a tech giant. Simply constructing a single numerical model, perhaps global in scale, would have been challenging enough. But the community made their wishes clear: a single model could never hope to encompass all the scales, processes, and concepts that lie at the forefront of the earth-surface sciences. The modeling system would have to be modular, with the ability to swap in alternative sub-models. It would have to address processes ranging from glacial erosion on high peaks to mud transport on submarine fans. And would have to embrace time scales ranging from storm events to geologic periods.
A small facility with just two or three research software engineers could never hope to build all of this, from scratch, by themselves. The key to success therefore lay in taking full advantage of existing resources, and making it an open community-wide project. It would be a “stone soup” vision: the facility provides the kettle, while the community brings the ingredients. The Integration Facility began with technology fronted by a graphical user interface. The CSDMS Modeling Tool displayed community-developed modules as graphical icons, which were coupled by drawing lines to connect inputs and outputs. Once assembled, the resulting model would run on a remote high-performance computing cluster. It was cloud computing before that term even existed.
The development team quickly discovered the need for two additional elements: a standard interface through which to operate and query each module, and a standard vocabulary—an ontology—for naming variables in a consistent way. The vocabulary standard addressed the proliferation of different names for the same thing ( “discharge” and “stream flow,” for example), as well as similar names for different quantities (means annual versus instantaneous discharge, for instance). Scott Peckham designed the ontology pattern, first as the CSDMS Standard Names, and later, with Maria Stoica, in an expanded version known as the Scientific Variables Ontology.
To meet the need for a standard programmatic interface, CSDMS developed the Basic Model Interface (BMI). In order to have a numerical model act as a modular component—a software “building block” that can be initialized, advanced, queried, given new data, and combined with other components—that model code needs to provide a consistent set of interface functions. The BMI specifies what these functions should look like: their names, their signatures, and their return types, as well as the syntax specific to particular programming languages. A model equipped with a BMI becomes interactive. You can advance it, pause execution, interrogate state variables, plot data—and exchange values with another model, which becomes the key to model coupling. Beyond that, the BMI provides a standardized operating mechanism: like the steering wheel and accelerator in a car, it offers a set of standardized controls that are the same from model to model, making the learning curve much simpler. And BMI is catching on. It’s now used, for example, in models developed by researchers at Deltares, the US Geological Survey, and the Netherlands eScience Center.
The CSDMS framework tool that makes use of BMI has continued to evolve. We learned that many, perhaps most, model coupling and model-data integration projects need a level of programmatic finesse that can only be handled by scripting. In response to this need, the script-based machinery behind the graphical front end was brought forward into a user-facing product: the Python Modeling Tool (pymt). With the 1.0 release in 2019, pymt recognizes the explosive growth in the popularity of Python in the geoscience community, and provides access to a collection of BMI-enabled components and tools, alongside Jupyter notebooks that provide hands-on tutorials. Pymt has already been used to power research ranging from permafrost to river and coastal morphodynamics.
Pymt provides a standardized, accessible pathway to legacy models and model-integration tools, but what about creating new models? New data and ideas drive new and refined theory, and that in turn requires adaptation of the numerical software that embodies these ideas. To meet the need for efficient creation and modification of numerical models, CSDMS supports the Landlab Toolkit. Landlab is a Python-language programming library that promotes standardization and re-use by providing interoperable process components that can be assembled, together with a grid object, to create complete integrated models. Since its 2016 debut, Landlab has featured in more than two dozen publications, with applications that collectively span hydrology, geomorphology, tectonics, ecology, basin stratigraphy, landslide hazards, and ecohydrology.
Still, much remains to be done to fully realize the CSDMS community’s vision. One challenge—not just in the geosciences, but across the sciences—lies in training. Many scientists report spending a large fraction of their research time in developing software, yet they also report being largely self-taught. Self-taught scientific programmers are less likely to be aware of tools and best practices that can significantly improve software reliability, transparency, reusability, and productivity. Clearly, geoscientists should not be expected to possess the complete skill set of a software engineer, yet some level of training beyond the status quo is essential if we are to have a computationally fluent scientific workforce. Domain-science facilities like CSDMS have an important role to play. To this end, in 2020 CSDMS launched a new summer institute for early career scientists (albeit initially a virtual one, due to the COVID-19 pandemic). Similarly, CSDMS continues to provide opportunities for community members to work directly with, and learn from, professional Research Software Engineers.
Likewise, a sustainable cyber-ecosystem requires rewards and incentives for contribution. The emergence of new software journals like the Journal of Open Source Software helps a lot here, by providing a formal review and publication venue for well-designed, tested, and documented research software. Domain-based awards that recognize software contributions, like the CSDMS Syvitski Student Modeler Award, are important ingredients as well.
Plenty of opportunities and challenges remain on the technology front. The increasing capability of cloud computing presents a potentially valuable resource for research, given the flexibility in hardware resources that it offers. And a critical frontier lies in discovery through data-model integration: a need that CSDMS has begun to address with a standard programmatic interface for accessing and sub-setting datasets, and a library of access functions known as Data Components. There is plenty of room to grow the library of BMI-enabled model components that can operate in frameworks like pymt. And Landlab has just begun to scratch the surface, with lots of potential for new capabilities such as automated matrix configuration tools, performance enhancement, visualization, and 3D gridding.
Looking back, it’s heartening see a growing and thriving community, and the roots of connection across interests and disciplines that have grown around it. CSDMS isn’t fully grown yet but it’s come a long way. Welcome to the teen years.
