Science spotlights
Science spotlights
Student Modeler Award 2020
April 2020 - June 2020

The 2020 Syvitski Student Modeler Award Winner is Ian Reeves, with his submission, "Impacts of Seagrass Dynamics on the Coupled Long-Term Evolution of Barrier-Marsh-Bay Systems".
Ian explores the impact of seagrass dynamics by incorporating these dynamics into an existing barrier-marsh exploratory model, GEOMBEST++, to examine the coupled interactions of the back-barrier bay with both adjacent (marsh) and non-adjacent (barrier island) subsystems. In the new integrated model, bay depth and distance from the marsh edge determine the location of suitable seagrass habitat, and the presence or absence, size, and shoot density of seagrass meadows alters the bathymetry of the bay and wave power reaching the marsh edge. While seagrass reduces marsh edge erosion rates and increases progradation rates in most model simulations, seagrass surprisingly increases marsh edge erosion rates when sediment export from the back-barrier basin is negligible because the ability of seagrass to reduce the volume of marsh sediment eroded matters little for backbarrier basins in which all sediment is conserved. Ian's work was also appreciated for the excellent software documentation - a hallmark of open source software development best practices.
Meet the Author
Ian Reeves a Ph.D. student in the Department of Geological Sciences at the University of North Carolina, Chapel Hill. His contact information and research interest can be found here.
Links
- Mode used: GEOMBEST++Seagrass
Reference
- Reeves, I.R.B., Moore, L.J., Goldstein, E.B., Murray, A.B., Carr, J.A., and Kirwan, M.L., 2020. Impacts of Seagrass Dynamics on the Coupled Long‐Term Evolution of Barrier‐Marsh‐Bay Systems. JGR Biogeosciences, V.125(2), e2019JG005416, doi: 10.1029/2019JG005416.
AGU December 8th workshop: sign up for Exploring Surface Processes - how to build coupled models
Fall 2019
Predicting long-term Earth surface change or the impacts of short-term natural hazards requires computational models. Many existing numerical models quantitatively describe sediment transport processes, predicting terrestrial and coastal change at a great variety of scales. However, these models often address a single process or component of the earth surface system. The Community Surface Dynamics Modeling System is a NSF-funded initiative that supports the open software efforts of the surface processes community. CSDMS distributes >200 models and tools, and provides cyberinfrastructure to simulate lithosphere, hydrosphere, atmosphere, or cryosphere dynamics. Many of the most exciting problems in these fields arise at the interfaces of different environments and through complex interactions of processes. This workshop presents cyberinfrastructure tools for hypothesis-driven modeling— the Python Modeling Tool (PyMT) and LandLab. PyMT allows users to interactively run and couple numerical models contributed by the community. There are already tools for coastal & permafrost modeling, stratigraphic and subsidence modeling, and terrestrial landscape evolution modeling (including hillslope, overflow, landslide processes, and a suite of erosion processes with vegetation interactions), and these are easy to run and further develop in a Python environment. The full-day tutorial aims to provide a short overview of the PyMT and Landlab, a demonstration of running a coupled model, and hands-on exercises using Jupyter notebooks in small groups of attendees. The organizers will facilitate break-out groups for discussion of pressing research needs and then have a plenary discussion with reports of each of the breakouts on future frontier applications of coupled landscape process modeling.
Instructors:
Attendance limit: 30 people
Register
Go to: https://www.agu.org/fall-meeting, and click on Register (even if you are already registered), and on Attendee registration. Log in and go to your AGU fall meeting registration page, select Make changes to registration, and then select 'Add/Modify Scientific Workshops and select Exploring Surface Processes: how to build coupled models.
Predicting Coastal Cliff Retreat for California
Summer 2018
Seventy-five percent of the coastline of California consists of sea cliffs. Cliff edges are desirable place to live because of the stunning views, and thus houses are built closely abutting the coast, but these cliffs are inherently unstable. Even over historic times, sea cliffs have been slowly retreating. The mechanism of sea cliff retreat are well-studied. It is known that when sea level rises, this reduced the relative distance between where the waves break and the cliff top position, and thus increases the frequency and efficiency of wave attack.
A JGR paper by Dr. Limber, Dr. Barnard and Dr. Erikson of the USGS, with co-author Dr. Vitousek of the University of Illinois provides a new approach to projecting cliff retreat rates into the 21th century. Cliff retreat models depend on cliff material and on environmental drivers like wave climate and storm frequency. The team designed a multi-model ensemble approach for modeling cliff erosion - a suite of simple models, each applied as a Monte-Carlo suite for several sea level scenarios. The process simplifications are notable, and this prompted the authors to calibrate each model locally to the last 30 year historic rates, thus accounting for large differences in cliff mother material. Then, each of the five selected models is driven by a nested suite of wave models; amongst them Wavewatch III and SWAN models, to arrive at projected future wave conditions. 500 simulations were run for each model, systematically varying parameters. Whereas such an ensemble approach may be relatively common in the climate sciences, it is quite novel in an application for morphodynamical coastal change predictions.
The models were applied for rising sea levels; with total anticipated rise by 2100 of 0.5m, 0.93m, 1.5m and 2.0m respectively. Notably, 0.93m is the sea level rise estimate used in coastal planning in the State of California. It was found from the models that reteat rates will increase. The increases for the higher sea level rise scenarios can add up to a twofold increase in retreat rates (with 20-40 m of landloss).
Meet the Author
Patrick Limber is a USGS research scientist with the Pacific and Coastal Marine Science Center. His contact information and research interest can be found here.
Reference
- Limber, P., Barnard, P., Vitousek, S., Erikson, L., 2018. A model ensemble for projecting multidecadal coastal cliff retreat duing the 21st century. Journal of Geophysical Research: Earth Surface 123. https://doi.org/10.1029/2017JF004401
The historical cliff retreat rates used in this study, multiple versions of model results, projected and hindcast wave time series, and related metadata are available through https://www.sciencebase.gov/
Quilting Surface Processes
Spring 2018
Surface processes are constantly reworking the landscape of our planet, resulting in distinct patterns, but with large variability. How do we acknowledge this variability in process-based models? And how do we know whether a distinct model prediction falls within the range of expected natural variability?
Researchers Julio Hoffiman, Celine Scheidt and Jef Caers of Stanford University are approaching quantification of surface processes with geostatistical techniques and applied machine learning. In a recent paper in Computers and Geosciences (Hoffiman et al., 2017) they develop techniques originating from data visualization sciences into new algorithms to unraveling landscape patterns into small patches and quilting them back together into synthetic sets of images to quantify uncertainty in sedimentary architecture. One example here shows data originating from an experimental delta (a St Anthony Falls tank experiment) with a deltaic network of channels and bars. The realizations below show resampled and quilted surfaces, simulations of the same geomorphic texture, but a different realization with the same general characteristics.
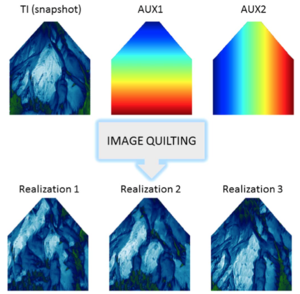
The basic concept originates from a technique that uses patches from an original image, and stitches them together using a minimum error approach which defines a ‘jigsaw’ shaped boundary. The approach was formulated by Efros and Freeman in 2001, and became important in visual design of games notable for background visualization. The technique has been more recently brought to 3D, and now allows for patching together cubes of patterns; which immediately appears relevant for subsurface architecture.
Julio Hoffiman develops his codes for high performance computing using ‘Julia’ - a high-level, high-performance dynamic programming language designed for numerical computing speeds at par with C and Fortran. The CSDMS Modeler Award committee commented that these open source codes are exceptional in every way, thoroughly documented and really innovative in their use of high performance computing techniques.
Find the code of ImageQuilting.jl as well as GeoStats.jl, a platform for high-performance geostatistics in Julia also being developed by Julio Hoffiman, on Github.
Meet the Author

Julio Hoffiman won the 2018 Syvitski Modeler Award for his geostatistical contributions and advances in high performance computing, and will present on his research at the May 2018 Meeting.
Julio is a graduate student at the Department of Energy Resources at Stanford University.
Get the Codes and Tinker
Source code: https://github.com/juliohm/ImageQuilting.jl
More on the programming language Julia: https://julialang.org/
References
- Efros, A., Freeman, W., 2001. Image quilting for texture synthesis and transfer. In: Proceedings of the 28th Annual Conference on Computer Graphics and Interactive Techniques, 1–6, http://dx.doi.org/10.1145/383259.383296
- Hoffiman, J., Scheidt, C., Barfod, A., Caers, J., 2017. Stochastic simulation by image quilting of process-based geological models
- 2017. Computers and Geosciences, 106, 18-32. https://doi.org/10.1016/j.cageo.2017.05.012
- Scheidt,C., Fernandes,A., Paola, C., Caers, J., 2017. Quantifying natural delta variability using a multiple‐point geostatistics prior uncertainty model. Journal of Geophysical Research: Earth Surface 121 (10), 1800-1818. http://dx.doi.org/10.1002/2016JF003922
Bedload transport rates higher in fine-grained rivers
Winter 2018
Commonly, low-lying river systems carry fine-grained sediments, but until now the physics of fine-grained bedload transport have remained poorly constrained. Traditional bed load transport equations, e.g. the Engelund-Hansen equation, appear to underestimate the sediment transport rate in at least one famous fine-grained river system, the Yellow River in China.
The Yellow River drains the Loess plateau and was known for its high sediment concentration and transport rates, although this sediment load has steadily declined over the last 60 years with terracing and engineering as well as revegetation (Wang et al., 2015).
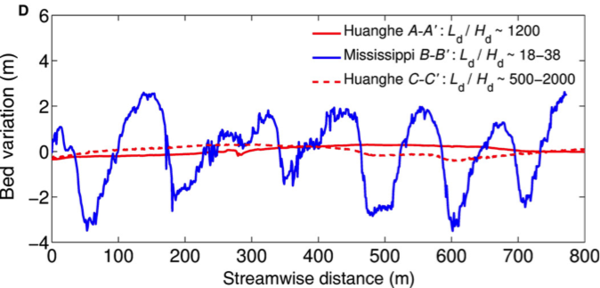
Rice University scientists Dr. Hongbo Ma and Dr. Jeff Nittrouer and their co-authors, presented in Science Advances (2017) an adjusted sediment transport relationship that takes into account that in fine-grained systems bedforms are hardly developed, and thus present minimal form drag, which enhances the river’s sediment transport efficiency. Their work was inspired by field observations on the Yellow River, traditional measurements of river water velocity and sediment concentration and bed sediment samples, as well as surveys of high-resolution river bathymetry. They found the river bed to be remarkably flat.
The figure here shows a comparison of collected bathymetry data on long profiles of bed elevation between the Yellow (Huanghe) River and the Mississippi River, illustrating the difference in bedform morphology. The A-A′ segment of the Huanghe bed profile shown was collected during low flow in 2016, whereas the C-C′ segment of Huanghe profile corresponds to the flood season period of WSRS in 2015. In either Yellow River profile bedforms are essentially flat as compared to a similar profile in the much coarser sand bed of the Mississippi River.
Undoubtedly, the research findings will be of interest to the Chinese engineers. The Yellow River flow of water and sediment is regulated by dams along the length of its course, and clearer water is used to scour the river bed periodically and this management technique may have unanticipated impacts on sediment transport capacity if it creates new higher amplitude bedforms on the river bed.
Meet the Author
Dr. Hongbo Ma is a postdoctoral fellow with Rice University, Houston, Texas, USA. His contact information and research interest can be found | here.
References
Ma, H. B., Nittrouer, J., Naito, K., Fu, X. D., Zhang, Y. F., Moodie, A., Wang Y. J., Wu B. S., and Parker, G. The exceptional sediment load of fine-grained dispersal systems: example of the Yellow River, China. Science Advances, 2017, 3: e1603114.
Wang. S., Fu, B., Piao, S., Lu, Y., Ciais, P., Feng, X., Wange, Y., 2016. Reduced sediment transport in the Yellow River due to anthropogenic changes. Nature Geoscience, 9, 38–41 (2016). doi:10.1038/ngeo2602
New Ideas on Channel-Forming Discharge
Fall 2017
It has long been recognized that any river continuously adapts to variations in flow and sediment load through changes in planform, bed level and bed material. In this context, one can define an ‘equilibrium profile’ of a river as the mean profile a river approaches when flow, sediment and base level vary around stable values for an extended period of time.
Dr. Blom and co-authors (JGR, 2017) review carefully the different approaches to formulate a representative steady river discharge that (if it would run for a long time) would yield the same channel geometry as the natural longterm hydrograph – the so-called channel-forming discharge. Knowing the channel-forming discharge is key for design of artificial irrigation channels and important in river restoration applications.
The paper lays out analytical solutions for 1D river profile geometry as a function of steadily varying discharge, without taking into account external processes like subsidence, uplift and base level changes. The authors first provide a solution for a system transporting sediment load of a single grainsize, but then proceed to cleverly introduce multiple grainsizes and abrasion in the sediment transport (i.e. sand and gravel).
Time-marching numerical experiments implemented several different load equations and thus provide validation of the proposed analytical solution. These experiments confirm earlier work, that channel slope and bed surface gravel content increase with increasing mean gravel content. When the authors apply their new theory for a dataset of variable discharge measured for the Rhine River at the border between the Netherlands and Germany they find that the model predicts channel bed slope should still be adjusting to less gravel content; and indeed adjustment has been observed over the last decade with only recent stabilization. This example serves to illustrate that even if 1D predictions are a simplification, the model helps assess first-order river stability or possible conditions prone to adjustment.
Meet the Developers
Dr. Astrid Blom is associate professor at Delft University of Technology, the Netherlands. Her contact information is here.
Graduate students Victor Chavarrías Borrás and Liselot Arkesteijn contributed to this research projects coding and data analysis.
Dr. Enrica Viparelli works as an Assistant Professor at the University of South Carolina, USA. Learn more about her lab here
Get the Code and Tinker
The code is freely available from GitHub and part of the CSDMS repository.
Documentation, installation instructions, and software dependencies are described in the metadata in the CSDMS repository Elv-GST metadata
References
This paper is part of a trilogy:
1. http://onlinelibrary.wiley.com/doi/10.1002/2016GL068898/full
2. http://onlinelibrary.wiley.com/doi/10.1002/2017JF004213/full
3. http://onlinelibrary.wiley.com/doi/10.1002/2017GL074231/full
Capturing overland flow-driven erosion: the OverlandFlow component in Landlab
Summer 2017
How does one model rain water flowing over the landscape? In many traditional landscape evolution models, focus is on long time scales, and flow routing processes are simplified to reduce the complexity of a system in favor of computational speed. In these methods, the entire evolution of rain rate over the duration of a storm and its aftermath at a point, the so-called event hydrograph, may be collapsed into a single temporally constant and/or spatially uniform representative value. This method differs from physically-based hydrodynamic models, which capture more dynamically a flood wave moving across a given model domain.
The OverlandFlow component described in Adams et al., (2017), was designed as part of the Landlab modeling framework (Hobley et al., 2017) to bridge the gap between traditional landscape evolution models and more complex runoff models. Based on an urban flood inundation algorithm (Bates et al., 2010, de Almeida et al., 2012), the OverlandFlow routes non-steady runoff across a landscape.
Adams et al., (2017) describes the background of the model algorithm and how to use it within Landlab. The model is applied as a event-based runoff model across a watershed DEM from central Colorado, USA. In this example, the model was able to generate realistic hydrographs and explore the potential erosion response of moderate storm events.
The OverlandFlow can also be flexibly coupled with other surface process components within the Landlab modeling framework. This paper also illustrates how the model can be coupled with a simple detachment-limited erosion scheme to explore erosion patterns on decadal timescales. Compared to the traditional steady-state hydrology approach, the OverlandFlow component erodes at a lower rate, with patterns of downstream increases in erosion rate. This suggests that landscapes evolved using the OverlandFlow method will be characterized by greater overall relief and increased channel concavities when compared to other landscape evolution modeling methods.
Landlab is written in Python and is available on Github. More information about the OverlandFlow component can be found on the Landlab website: http://landlab.github.io/
Meet the Developers
Jordan Adams is a graduate students at Tulane University. Her contact information is here.
Get the Code and Tinker
The code is freely available from Github and part of the CSDMS repository.
Documentation, installation instructions, and software dependencies for the entire Landlab project can be found at http://landlab.github.io.
A detailed user manual and driver scripts for the applications illustrated in this paper can be found at Adams, 2016, GitHub Repository.
Reference
- Adams, J. M., Gasparini, N. M., Hobley, D. E. J., Tucker, G. E., Hutton, E. W. H., Nudurupati, S. S., and Istanbulluoglu, E.: The Landlab v1.0 OverlandFlow component: a Python tool for computing shallow-water flow across watersheds, Geoscientific Model Development, 10, 1645-1663, doi:10.5194/gmd-10-1645-2017, 2017.
- Bates, P. D., Horritt, M. S., and Fewtrell, T. J.: A simple inertial formulation of the shallow water equations for efficient two-dimensional flood inundation modelling, Journal of Hydrology, 387, doi:10.1016/j.jhydrol.2010.03.027, 2010.
- de Almeida, G. A. M., Bates, P., Freer, J. E., and Souvignet, M.: Improving the stability of a simple formulation of the shallow water equations for 2-D flood modeling, Water Resources Research, 48, doi:10.1029/2011wr011570, 2012.
- Daniel E. J. Hobley, Jordan M. Adams, Sai Siddhartha Nudurupati, Eric W. H. Hutton, Nicole M. Gasparini, Erkan Istanbulluoglu, and Gregory E. Tucker, 2017. Creative computing with Landlab: an open-source toolkit for building, coupling, and exploring two-dimensional numerical models of Earth-surface dynamics. Earth Surf. Dynam., 5, 21–46, 2017. http://www.earth-surf-dynam.net/5/21/2017/ doi:10.5194/esurf-5-21-2017
Built It From Scratch!
January-February 2017
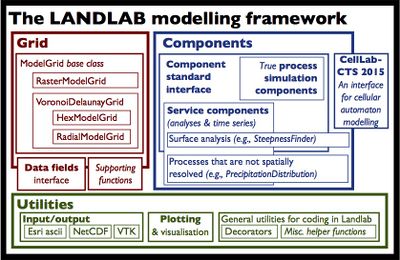
The ability to model surface processes and to couple them to both subsurface and atmospheric regimes has proven invaluable to research in the Earth and planetary sciences. However, creating a new model typically demands a very large investment of time, models are often designed to address a specific problem and difficult to adapt. The Landlab modeling toolkit, described in a new paper published in ESURF by Daniel Hobley and coauthors, is explicitly designed to eliminate code specificity, accelerate new code development, and reduce the challenges that arise every time a scientist wants to model a new problem in Earth surface dynamics. Landlab is an open-source software framework that provides: 1. a set of tools and existing grid structures – including both regular and irregular grids – to make it faster and easier to develop new process components, or numerical implementations of physical processes; 2. a suite of stable, modular, and interoperable process components that can be combined to create an integrated model; and 3. a set of tools for data input, output, manipulation, and visualization.
Hobley et al.’s paper discusses the design, rationale, and implementation of the different parts of the Landlab toolkit. Landlab’s structure makes it ideal not only for fully developed modelling applications, but also for model prototyping and classroom use. Because of its modular nature, it can also act as a platform for model intercomparison and epistemic uncertainty and sensitivity analyses. Landlab exposes a standardized model interoperability interface, and can couple to third party models and software. Landlab also offers tools to allow the creation of cellular automata, and allows native coupling of such models to more traditional continuous differential equation-based modules. Examples of component coupling in Landlab are illustrated using a model of landform evolution, a cellular ecohydrologic model, and a flood-wave routing model.
Meet the Developers
The lead author on the paper, Dan Hobley, is a lecturer and research fellow at Cardiff University.
Jordan Adams and Sai Siddartha Nudurupati are graduate students at Tulane University and the University of Washington, respectively. Eric Hutton is a research scientist at CSDMS. Erkan Istanbulluoglu and Nicole Gasparini are associate professors at the University of Washington and Tulane University. Gregory Tucker is a full professor at the University of Colorado, Boulder.
Get the Code and Tinker
The code is freely available from Github and part of the CSDMS repository. It can also be downloaded from the conda and pip Python package managers.
Reference
- Daniel E. J. Hobley, Jordan M. Adams, Sai Siddhartha Nudurupati, Eric W. H. Hutton, Nicole M. Gasparini, Erkan Istanbulluoglu, and Gregory E. Tucker, 2017. Creative computing with Landlab: an open-source toolkit for building, coupling, and exploring two-dimensional numerical models of Earth-surface dynamics. Earth Surf. Dynam., 5, 21–46, 2017. http://www.earth-surf-dynam.net/5/21/2017/ doi:10.5194/esurf-5-21-2017
Linking Earth System Dynamics and Social System Modeling
November - December 2016
The Earth system is increasingly dominated by human action, and at the same time Earth system processes continue to significantly impact human life and well-being. This creates an urgent need for integrated human and Earth system models (HESMs) that are capable of capturing the dynamics of both biogeophysical and social systems models of human decisions and actions. Such integrated models will provide new insights into the multi-scale interactions among markets, atmospheric physics, energy consumption, terrestrial hydrology, water use, soil biochemistry, land use, and other societal and biophysical processes.
CSDMS is leading this ambitious integrated modeling effort, and hosted the first of several workshops on Computational Human and Earth System Science (CHESS) in Boulder on May 23-25th 2016. The workshop brought together a diverse group of multi-disciplinary researchers to develop a strong research plan and timetable for the integration of human systems models with Earth systems models. The workshop and a follow-up teleconference on August 5, 2016 initiated the process of assessing the intellectual, informatics, and material resources needed to develop models of human systems dynamics and couple them with models of Earth system dynamics.
More model information
More information about the May 23-25th, 2016 workshop at Boulder can be found at: Computational Human and Earth Systems Science (CHESS). This is also where many of the presentations can be viewed.
New Model for Simulating Land Use Change: ClueMondo
August - October 2016
The human dimensions group offers the CSDMS community models of land use change with varying methods of capturing human controlled drivers. Several models exist that simulate global land use change. Often these models are designed to assist with Integrated Assessment studies. One of such models is now made available through the repository; ClueMondo.
Land-use is controlled both by biophysical and socioeconomic processes; i.e. crops have soil and climatic requirements, but will only be grown extensively in response to human decisions driven by local and global markets (Verburg et al., 2011). ClueMondo simulates changes in ‘land systems’, with each land system being described by land cover, cropland area, livestock density and intensity of agricultural production in fractional coverage at a 5 arc-min scale.
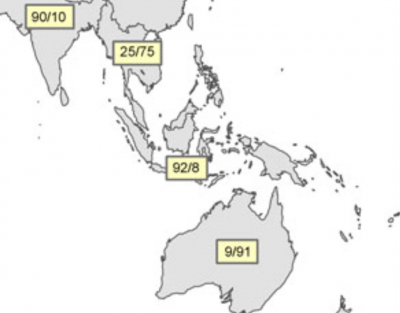
A recent paper by Van Asselen and Verburg describes ClueMondo and applies it to a OECD environmental outlook, which forecasts on a macrolevel that arable production will increase 64%, livestock numbers will go up 57% and built-up area, e.g. cities, will more than double. The ClueMondo model then maps changes in land-system types at a more regional scale. Results highlight the increases in agricultural productions in Turkey, Northern China, India, parts of Africa and Latin America. The regional scale simulated maps demonstrate that expansion of built up areas mostly are nucleated from existing urban areas. Interestingly, the model results can also be used to divide between crop land systems that intensify, or crop land systems that expand by conversion of land that previously was non-cropland. This analysis of ClueMondo output is relevant in the current debate in conversation biology on ‘land sparing’ versus ‘land sharing’. Conservationist ask whether more biodiversity is maintained when we intensify agriculture in existing (but smaller) areas and at the same time spare other areas in a more natural state. Or whether more biodiversity is maintained when there is less intensive agriculture and only low-intensity agricultural areas are allowed to expand. Whereas the question on biodiversity stability cannot be addressed by these model results directly; ClueMondo prognosis show vastly different growth scenarios per region. For example, Australia will mostly accommodate crop production growth over 2000-2040 in expansion (91%), whereas nearby Indonesia will see crop production go up as well, but there the growth is driven by intensification (92% of the change). ClueMondo is a new tool to further explore such scenario modeling in which different types of demands drive land-use change.
More model information
ClueMondo Information and code download
References
- Van Asselen, S. and Verburg, P.H., 2012. A land system representation for global assessments and land-use modeling. Global Change Biology 18, 3125-3148. doi:[1]
- Van Asselen, S., Verburg, P., 2013. Land cover change or land-use intensification: simulating land system change with a global scale land change model. Global change biology, 19, 3648-3667. doi:[2]
- Kremen, C. 2015. Reframing the land-sparing/land-sharing debate for biodiversity conservation. Annals of the New York Academy of Science 1355, 52-76.doi:[3]
Meet the modeler
Peter Verburg's webpage at the Institute for Environmental Studies
Damsgaard wins CSDMS Student Modeler Award
February 2016

Dr. Anders Damsgaard, is selected as the CSDMS Student Modeler of 2015. Damsgaard models glacier flow over a soft-sediment bed from the single grain scale. Bed deformation plays a major role in this process and the novel model is applied to provide insights on the precise interaction of sediment grains and fluids under pressure at the glacier bed. His research was dne as part of his phD thesis at Aarhus University, Denmark. He is now a postdoctoral fellow at Scripps Oceanographic Institute.
A discrete element method is used to simulate the granular phase is simulated on a per-grain basis and the model treats porewater as a compressible Newtonian fluid. The model is in Python and is open source code. Findings from a set of model simulations show that the extremely low viscosity of water means that deformational of dense granular material, like subglacial till, is governed by inter-grain mechanics. The porosity of the sediment packing evolves towards a critical-state value with increasing shear strain. Changes in porosity cause deviations from the hydrostatic pressure if the rate of porosity change exceeds the rate of pressure diffusion, which is impacted by both the local porosity and permeability. The built-up to a critical state, and subsequent temporal changes in sediment strength may explain observed variability in glacier movement.
Damsgaard was also involved in a recent paper in Computers and Geosciences on advancing glacier models by using graphics cards.
More model information
References
- Damsgaard A., Egholm, D.L, Piotrowski, J., Tulaczyk, S., Larsen, N., Braedstrup, C., 2015. A new methodology to simulate subglacial deformation of water-saturated granular material. The Cryosphere, 9, 2183-2200. doi:10.5194/tc-9-2183-2015
- Damsgaard, A., D.L. Egholm, J.A. Piotrowski, S. Tulaczyk, N.K. Larsen, and K. Tylmann. 2013. Discrete element modeling of subglacial sediment deformation. Journal of Geophysical Research: Earth Surface. 118, 2230–2242. doi:10.1002/2013JF002830
- C.F. Brædstrup, A. Damsgaard, D.L. Egholm. Ice-sheet modelling accelerated by graphics cards. Computers & Geosciences. 72, 210–220 (2014).
Meet the modeler
A classic modelers style webpage, already in the air since 1986: Anders personal webpage
Or follow Anders Damsgaard on Twitter .
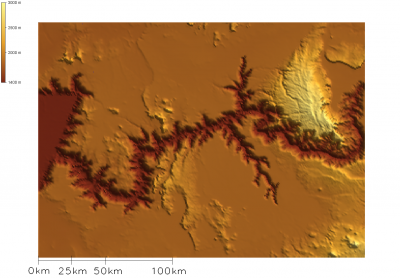
Mountain Growth Separates Fish Populations
December 2015-January 2016
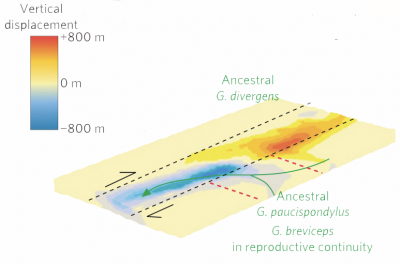
The concept that over the evolution of a mountain range river drainages can abruptly change and create local biodiversity has been recognized for some time.
Yet, this study by Dave Craw of the University of Otago, Phaedra Upton of GNS, New Zealand, and co-authors, combines reconstruction of regional mountain building and topographical evolution over the last 25 million year with genetic evidence. They published their results in the December 14th, 2015 issue of Nature Geoscience.
Phylogenetic analyses of freshwater fish populations included over 1,000 specimens from more than 400 localities, and clearly demonstrate that fish genomes can retain evidence of the tectonic evolution of the South Island of New Zealand. “Evolutionary trees” can be constructed for both fish populations and the concurrent tectonic separations.
Tectonic reconstructions originate from simulations performed with the numerical code FLAC 3D (Itasca 2012). FLAC 3D treats rock as a continuum, utilizing a modified Lagrangian finite difference technique represented by average values of mechanical properties. Mechanical properties are defined by the size of the zones within the model, which in this study are on the order of kms. The upper crust of both models is represented by an elasto-plastic Mohr-Coulomb rheology, whereas the mantle is modeled as an elastic rheology. Notably, the different fault blocks on the South Island of New Zealand are distinctly different; some blocks are known to have a strong and thin (~15 km) crust, nearby blocks comprise a mid-crust that is weak and thick (30-35 km). The illustration shows the FLAC3D mechanical modeling results of progressive evolution of topography in a strike-slip tectonic regime with distinctly separate fault blocks after 9 million years.
It is from these contrasting properties that the tectonic evolution becomes non-uniform and drainage basin captures evolve.
The study provides an example of how natural changes in the Earth’s landscape and topography at long time scales can cause rapid changes in local biodiversity.
More model information
Find more on the used model Flac3D
References
- Upton, P., Koons, P.O., Craw, D., Henderson, C.M., & Enlow, R. Along-strike differences in the Southern Alps of New Zealand: Consequences of inherited variation in rheology. Tectonics 28: TC2007 (2009). doi:10.1029/2008TC002353
- Craw, D., Upton, P., Burridge, C., Wallis, G., Watersdoi, J., 2015. Rapid biological speciation driven by tectonic evolution in New Zealand. Nature Geoscience. doi: 10.1038/ngeo2618
Meet the modeler
Phaedra Upton at GNS.
Interested? Find similar modeling in the CSDMS Geodynamics_Focus_Research_Group.
Salt Marshes with Jagged Edges?
September-October 2015
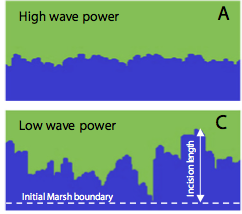
Have you ever stood at the muddy drop-off edge of a salt marsh? Was the edge uniform and straight, or jagged with small inset coves? Recent research reported in Geology and Geophysical Research Letters shows that salt marsh edges evolve to be straight under high wave power regimes, and to be jagged under low wave power regimes. A cellular automata model predicts that specifically under low wave power conditions local resistance of each cell to erosion remains a dominant factor, and this variability in erodibility creates the typical small inset coves along marsh edges. This can be explained by the long time it takes to erodes the very resistant cellls, but once they are removed a rapid collapse and removal of adjacent weak substrate occurs.
Model experiments were accompanied by monitoring of salt marsh edge retreat over several years in the tidal marshes of Plum Island Sound and the Virginia Coast reserve, along the East Coast of the US. Repeat monitoring corroborates the model predictions; sheltered sites have a more jagged appearance whereas the most exposed and more rapidly eroding salt marshes have a more straight profile.
Boston University graduate student, Nicoletta Leonardi, and Associate Professor, Sergio Fagherazzi, contributed their salt marsh evolution code, called Auto_marsh, to the CSDMS model repository. The code is written in Matlab and runs on a single processor, it is meant for use in further research as well as for teaching.
More model information
Go here to find metadata on this code and download it.
References
- Leonardi, N., Fagherazzi, S., 2014. How waves shape salt marshes. Geology, 42,10, 887-890. doi: 10.1130/G35751.1
- Leonardi, N., and S. Fagherazzi, 2015. Local variability in erosional resistance affects large scale morphodynamic response of salt marshes to wind waves, Geophysical Research Letters, 2015GL064730, doi: 10.1002/2015GL064730
Meet the developer
homepage of Nicoletta Leonardi
WILSIM Grand Canyon
July-August 2015
WILSIM is a web-based landscape evolution model. WILSIM has been developed with the idea that computer simulations can provide students with the opportunity to observe, interact with, and explore earth surface processes. A hands-on activity allows learners to cast hypotheses and then investigate process-response relationships. Students can enhance their understanding of longterm processes, in this case river incision, by changing key model input parameters and observe the effects on the virtual landscape. WILSIM has been improved from the original model, which was a cellular automata model for landscape evolution, to a more physics-based approach. Dr. Wei Luo of Northern Illinois University in collaboration with Prof. Jon Pelletier of Arizona University has now included explicitly the processes of bedrock channel erosion and weathering and cliff retreat. The model allows for definition of different parent material, i.e. hard and soft bedrock.
WILSIM is implemented in Java OpenGL, to provide fast graphics. The model is multi-thredded to take advantage of modern multi-core CPUs. There are separate threads for model computation, visualization, and for the user interface.
The development team of WILSIM has focused on its efficient use for teaching at the undergraduate level. This model is well documented and provides detiled documentation on its efficient use in a classroom setting.
Use the code and find selected teaching activities
Reference
- Learn more from a recent presentation at the CSDMS meeting
- Luo Wei, Jon Pelletier, Kirk Duffin, Carol J. Ormand, Wei-chen Hung, Ellen Iverson, Xiaoming Zhai, Kyle Whalley, Courtney Gallaher, Walter Furness, and David Shernoff (2015). Computer Simulation Significantly Enhances Students' Learning of Landform Evolution: AAG (Chicago, IL).
- Luo, W., Peronja, E., Duffin, K., and Stravers, A. J., 2006. Incorporating Nonlinear Rules in a Web-based Interactive Landform Simulation Model (WILSIM). Computers and Geosciences, v. 32, n. 9, p. 1512-1518 (doi: 10.1016/j.cageo.2005.12.012).
- Luo, W. and M. Konen, 2007. New results from Using a Web-based Interactive Landform Simulation Model (WILSIM) in a General Education Physical Geography Course. Journal of Geoscience Education, v. 55, n5, p. 423-425.
Meet the author
SLEPIAN-alpha, bravo, charlie and echo
March-April 2015
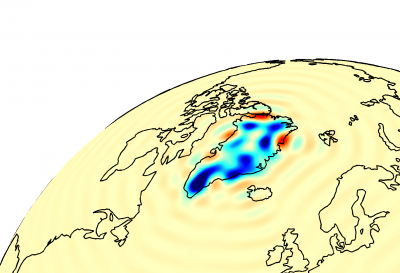
Satellite data on magnetic or gravitational potentials are uniformly distributed over the Earth, which allows the use of spherical harmonics for the data analysis. Spherical harmonics are used to represent functions defined over the entire surface of a sphere. But if there are gaps in the data, or the region of interest is only a small part of the sphere as a whole, then you may be better off using ‘Slepian functions’ say Dr. Harig and co-authors in a newly published feature article in AGU EOS magazine in April 2015 (Harig et al., 2015). Slepian functions are designed to analyze data over spatially-limited regions.
Harig and Simons (PNAS, 2012) demonstrated the use of the SLEPIAN toolkit in a detailed spatial mapping of Greenland’s Ice Sheet mass loss over 2002-2011. Whereas the difference in total ice mass loss over all of Greenland as estimated from Gravity Recovery and Climate Experiment (GRACE) data has become smaller between different analyses, researchers have had less information on the spatial pattern of its ice mass change. The detailed maps show areas of mass accumulation (in central Greenland), and give insight in the shifts in regional mass losses.
The CSDMS model repository now has the SLEPIAN tools metadata here as well as a download in the GitHub version-control environment. SLEPIAN-Delta comprises the code specifically designed for GRACE satellite data analysis. You can download it here: (https://github.com/csdms-contrib/slepian_delta)
Reference
- Harig, C., K. W. Lewis, A. Plattner, and F. J. Simons (2015), A suite of software analyzes data on the sphere, Eos, 96, doi:10.1029/2015EO025851. Published on 10 March 2015.
- Harig, C., Simons, F., 2012. Mapping Greenland’s mass loss in space and time. PNAS, 109, 49, doi:10.1073/pnas.1206785109.
Meet the author
mARM5D soil evolution model
January 2015
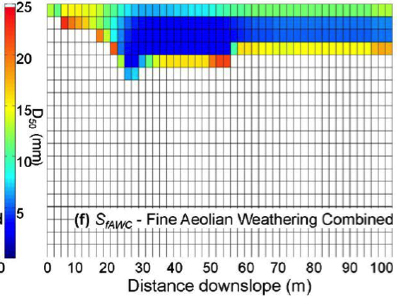
The MARM5D model simulates soil evolution with depth for landscape grids, while keeping track of sediment particle size distribution. Since the model operates over 100’s of 1000’s of years of landscape evolution, it warrants the 5D prefix. Soil formation in the model depends on bedrock and soil physical weathering, sediment transport by overland flow, diffusive hillslope processes, like soil creep. New functionality in the most recently submitted code adds a routine to simulate aeolian deposition.
The model is a joint international effort of Dr. Sagy Cohen, University of Alabama in Tuscaloosa, Gary Willgoose and Greg Hancock, of the University of Newcastle, and Tal Svoray and Shai Sela of Ben Gurion University, Israel. In several publication they have highlighted the model algorithms and their implications for soil formation. Their latest Journal of Geophysical Research paper is currently published on-line (Cohen et al., online 2014).
Model simulations highlight the importance of surface armoring in soil evolution. Under bedrock-weathering dominated conditions, and depth-dependency of soil production, armoring reduces soil erosion to steady-state soil grading and depth and a relatively uniform soil distribution. Aeolian-dominated landscapes tend to much greater patchiness in both the absolute soil depth and the grainsize distribution at the surface. This spatial variability is show in the associated figure, which displays the vertical soil profile and grainsize with depth as predicted with Marm5D along a 100 m simplified hillslope. These results are for one particular scenario combining the processes of fine sediment aeolian transport and soil weathering.
Reference
- Cohen, S., G. Willgoose, and G. Hancock (2009), The mARM spatially distributed soil evolution model: A computationally efficient modeling framework and analysis of hillslope soil surface organization, Journal of Geophysical Research, 114, F03001, Doi:10.1029/2008JF001214
- Cohen, S., G. Willgoose, and G. Hancock (2010), The mARM3D spatially distributed soil evolution model: three-dimensional model framework, and analysis of hillslope and landform responses, Journal of Geophysical Research, 115, F04013, Doi:10.1029/2009JF001536
- Cohen, S., G. Willgoose, T. Svoray, G. Hancock, and S. Shela, (online 2014). The effects of sediment-transport, weathering and aeolian mechanisms on soil evolution, Journal of Geophysical Research, Earth Surface, online December 2014. Doi: 10.1002/2014JF003186
Meet the author
CLIFFS tsunami model
November 2014
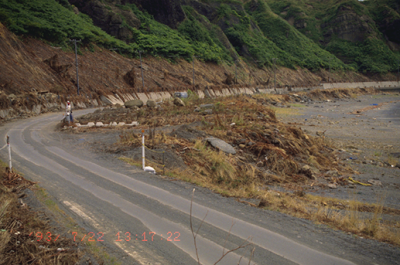
Dr. Elena Tolkova, a tsunami modeler with NorthWest Research Associates, Redmond (www.nwra.com), contributed her tsunami model, CLIFFS, to CSDMS. CLIFFS computes tsunami propagation and runup on land, under the shallow-water approximation. The model's description was recently published in ‘Pure and Applied Geophysics’. CLIFFS brings an improved treatment of the land-water boundary, including a new approach to modeling runup of a tsunami wave hitting the coast, compatible with a propagation algorithm used in MOST (a NOAA tsunami model).
The CLIFFS model is written in Fortran; it typically simulates a few hours to 1-2 days of a tsunami event at the global, regional, or local scale within a few minutes to 2-4 hours of computational time, on an average desktop computer. The model is well-documented, and the code is maintained in the Github repository. More information on the model can be obtained through the CSDMS [4]
In May 2011, the National Tsunami Hazard Mitigation Program organized a workshop where it established a set of benchmarks to validate numerical tsunami models. These benchmark data, which include theoretical problems, wave tank experiments, and a field case, were archived and are available through Github (https://github.com/rjleveque/nthmp-benchmark-problems).
CLIFFS has been tested with the complete set of NTHMP-adapted benchmark tests focused on inundation, and its solutions are compared to the MOST solutions. Set-ups to perform some benchmark tests with CLIFFS can be found at http://elena.tolkova.com/Cliffs.htm (Examples 1,2).
The real-world event used as a tsunami benchmark case happened on July 12, 1993 when a magnitude Mw 7.7 earthquake struck in the Sea of Japan near Hokkaido. The tectonic displacement of 2.5 m along a 150-km-long rupture gave rise to a tsunami that severely impacted the region. According to USGS, the earthquake and the subsequent tsunami caused 240 fatalities, 540 houses were destroyed, and approximately 600 fishing boats were damaged or lost off western Japan, southeastern Russia and South Korea. Tsunami wave height as high as ~31 meters was reported along the southwest coast of Okushiri Island in Japan, 10 meters along the west coast of Hokkaido, 3 meters at Nakhodka, Russia, 2 meters along the northeast coast of South Korea, and nearly 1 meter at Aomori, Honshu. The photo shows the West coast of Okushiri Island. The Sea of Japan, to the right, in this area has a tide range of less than 0.5 m. The tsunami waves crossed the roadway, splashed onto the hillside and killed the native plants and grasses as can be seen on the photo. The tsunami here reached inland about 10 meters above sea level.
A complete numerical set-up to simulate this event with CLIFFS from the source earthquake to the inundated Okushiri shores can be obtained at http://elena.tolkova.com/Cliffs_data/OkushiriTsunami.zip
Reference
- Tolkova E., 2014. Land–Water Boundary Treatment for a Tsunami Model With Dimensional Splitting. Pure Appl. Geophys., 171(9), 2289–2314. Doi:10.1007/s00024-014-0825-8
Meet the author
Contemporary sediment yields of the continent Africa
August-October 2014
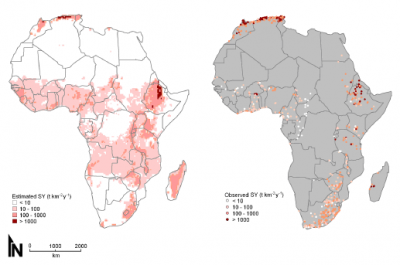
In a recent paper, Matthias Vanmaercke et al. (2014) attempt to get a better understanding of what controls the spatial sediment yield (SY) of the continent Africa. This is of importance as most global SY studies underrepresent this continent, despite expected large population increases and climatic changes in the nearby future. By applying correlation analyzes, the spatial difference of SY, observed for 682 catchments, can best be explained by differences in: seismic activity, topography, vegetation cover and runoff.
The presented SY relation explains only 40% of the observed variability of SY. The large fraction of uncertainty is most likely clarified by uncertainties in many of the applied SY observations as well as their predictive variables to establish this relation.
It is remarkable that seismic activity correlates so strongly with SY as Africa experiences only limited seismic activity. The study indicates that the mechanisms explaining this correlation are still poorly understood, but may relate to the seismic weakening of surface lithologies, tectonically induced changes in river base levels or earthquake-triggered landsliding. Seismic activity is often neglected in regional SY studies for Africa but should be incorporated.
Reference
- Vanmaercke, M., Poesen, J., Broeckx, J., and Nyssen, J., 2014. Sediment Yield in Africa. Earth Science Reviews, 136: 350-368 (+ Appendix). Doi:10.1016/j.earscirev.2014.06.004
Vectors to Represent Meandering Channels
March-July 2014

Rivers meander by bank erosion and pointbar accretion. Ajay Limaye, a Phd student with Mike Lamb at the California Institute of Technology, presented a new vector-based method to keep track continuously of eroded and accreted sediment. This new method allows feedback between bank strength and channel migration rates without discretizing the substrate properties and provides distinct advantage to previous efforts.
In a recent paper in the Journal of Geophysical Research (2013), Limaye models how erosion-resistant clays that fill in abandoned channels subsequently prevent bank erosion locally and force the channel belt into a narrowing stretch. This effect is illustrated in the left panel; it is a landscape after 1000 years of model simulation, wherein the green line is the initial channel which visited the grey area over time and filled the meander cutoffs with clay, and the blue line is the final channel encapsulated in the recently visited active channel belt area (in white). In another application, the model is capable to erode a bedrock channel and widen its valley while taking into a account a mixed bedrock and alluvium substrate.
It is evident that this new technique to model meandering channels avoids common pitfalls associated with grid-resolution with respect of typical migration rates. The first presented case-studies show that erodibility differences have a profound influence on channel evolution and much more exploration of these effects are possible.
Reference
- Limaye, A., Lamb, M.P., 2013. A vector-based method for bank-material tracking in coupled models of meandering and landscape evolution. Journal of Geophysical Research: Earth Surface, Vol 118, 1-17. Doi:10.1002/2013JF002854
Links
The authors profiles:
- Ajay Limaye page at the University of Virginia
- Mike Lamb faculty information at Cal Tech
Vegetation Can Increase Bedload Flux
December 2013 - January 2014
Vegetation grows abundantly in floodplains, and can change flow dynamics, sediment transport and aquatic habitats. The way vegetation changes the vertical velocity profile depends on the roughness that the plants or trees create, which in turn depends on their density and whether they are submerged or not. Vegetation can create intricate flow turbulence structure like von Karman vortices and horseshoe vortices.
Fluid dynamicists, Prof. Elowyn Yager of the University of Idaho and Prof. Mark Schmeeckle of Arizona State University, used sandbox experiments to compare different vegetation densities. Yager and Schmeeckle designed flumes ‘planted’ with metal stakes to represent rigid stems as emerged objects altering flow conditions. They used 0.5 mm sand and scaled their conditions to Reynolds and Froude numbers representative of fully developed rough turbulent flow. In addition, one experiment was conducted with real grass planted on a small pointbar in the creek of the outdoor stream laboratory at the St Anthony Fall Laboratory of the University of Minnesota. The experimentalists varied flow conditions systematically, while a high-speed video camera collected data on bedload transport. Relatively large bedforms and scouring features were generated in all of the flumes with stakes. The experiments showed that the impact of vegetation was extremely variable, and ultimately dependent on the combination of the vegetation density, flow velocity and he total boundary shear stress. The observed complexity has two important consequences: 1) one cannot make simplified assumptions on the effects of vegetation on patch-averaged sedimentation rates, and 2) commonly used bedload transport equations may need to be modified to incorporate terms to adjust for vegetation effects. Both these finding call for improved bedload flux predictions needed to help river restoration design.
Reference
- E. M. Yager, M. W. Schmeeckle 2013, The influence of vegetation on turbulence and bed load transport, Journal of Geophysical Research, Volume 118, Issue 3, pages 1585–1601, September 2013. Doi:10.1002/jgrf.20085
Links
The authors profiles:
- Elowyn Yager faculty page at Center of Ecohydraulics Research at the University of Idaho
- Mark Schmeeckle faculty information at Arizona State University
- More on the outdoor stream lab at St Anthony Falls Laboratory: SAFL outdoor lab page
Disentangling Rivers
June 2013 - July 2013
Andrew Nicholas of Exeter University presents a new model, HSTAR-Hydrodynamics and Sediment Transport in Alluvial Rivers- in Geology, April 2013. This model solves the depth-averaged shallow water equations for a grid of cells that represent a river and its floodplain of ~ 50km by 16km. It thus calculates sand and silt transport with a physics-based approach. The unique aspect of this model is that it includes a classification for gridcells, which have been dry for some time, and then establishes vegetation (adding to the roughness of the surface). Thus a feedback mechanism is created, in which the vegetated surface slows down the eventual floodwater and traps sediment to further increase the bar or island height.
The HSTAR model output shows remarkably detailed river morphology; bar development and downstream migration, island formation, single-thread channels and multi-thread channels. All these distinct river features can be recognized in the simulation output. Simulations of 270-350 years show a variety of river channel regimes develop; more meandering morphology and dynamical braiding both can be generated with variation in input conditions. Nicholas identifies a critical role for three interrelated factors: rate of floodplain development, bank erodibility and relative mobility of bed sediment.
The study compares key features and predictions with data from large natural rivers and found good consistency. The model simulations are a spectacular demonstration of short-term river morphological evolution.
References
- Nicholas, A. P., 2013. Morphodynamic diversity of the world’s largest rivers Geology, April 2013, 41, 475-478, [5]
- Nicholas, A.P., 2013. Modelling the continuum of river channel patterns. Earth Surface Processes and Landforms. [6]
Links
- Website of the Model Author: Andrew Nicholas at Exeter.
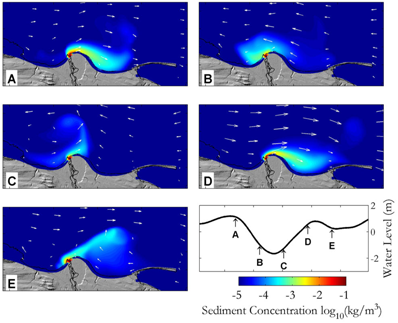
Successful Coupling of D-FLOW FM and SWAN with BMI interface
June 2013
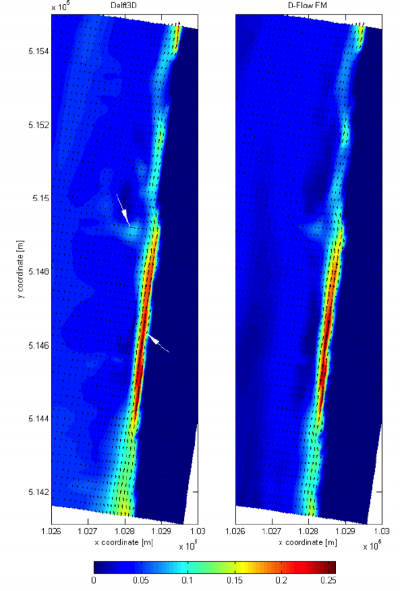
D-FLOW FM is the newly developed unstructured version of the Delft3D Flow module, it allows model domain resolution to be flexible. Recently, this advanced model was dynamically coupled with SWAN- a phase-averaged wave model as part of the thesis work of graduate student Bas Stengs. Stengs worked with his advisors Prof. Marcel Stive and Prof. Guus Stelling in close collaboration with the Deltares developer team to incorporate wave modeling into D-FLOW-FM.
SWAN and D-FLOW FM are both large FORTRAN codes, which run on high-performance computing systems to calculate detailed hydrodynamical processes and wave characteristics in the coastal zone. Whereas these codes previously have been used in tandem, they are now more dynamically linked. Stengs describes his software coupling methodology as the ‘Hollywood Principle’ – a principle that takes its name from the standard response aspiring actors get after an audition in Hollywood, ‘don't call us, we call you’. In software this principle is used to describe an architecture in which an overarching system sends calls to individual codes to perform a task or a calculation. This has great advantages: SWAN and D-FLOW FM can run with different computational steps and still exchange information at appropriate intervals, and the data transfer occurs rapidly through internal memory as opposed to data exchange by files.
To accomplish the dynamic coupling Stengs used the ESMF framework (Collins et al., 2005) as the overarching driver which controls the time-stepping and calling of the individual engines, as well as the regridding. To allow fast exchange of model variables a basic modeling interface (BMI) was built for both D-FLOW FM and SWAN. The Basic Modeling Interface has recently been designed and implemented at the CSDMS Integration Facility (Peckham et al., 2013) and it was the first time BMI has been developed entirely independently by CSDMS community members. The dynamic software coupler allows a more interactive modelling experience, and serves as a comprehensive tool for general model understanding.
To test whether the implementation of the coupling of the wave model with the flow model was successful a number of benchmarks had to be passed. Four different test cases were considered ranging from an analytical solution to a non-uniform barred beach case-study along the Dutch Coast at Egmond. You can see the comparison of the new model (right panel) and previous Delft-3D simulation output (left panel). The model appears to capture both rip channel features as well as high velocity current close to shore. From the test cases, it is concluded that modelling waves in D-Flow FM gives generally good agreement with validated Delft3D models. Past studies have proven the benefits of unstructured modelling over structured techniques, which shows high potentials for D-Flow FM. Now with the inclusion of wave effects in D-Flow FM, a potential further improvement to nearshore modelling is made provided more extensive validation.
References
- Peckham, S.D., Hutton, E.W.H., Norris, B., 2012. A component-based approach to integrated modeling in the geosciences: The design of CSDMS. Computers & Geosciences: Modeling for Environmental Change, 53:3 – 12.
- Collins, N., Theurich, G. DeLuca, C., Trayaonv, A. Li, P., Yang, W., Hill, C. (2005). Design and implementation of Earth System Modeling Framework components. International Journal of High Performance Computing Applications.
Links
- Link to the DeltaRes Open Source website for D-FLOW FM: [7]
- More on the Basic Model Interface: BMI_Description
Student Modeler Award 2012
April 2013 - May 2013
The glaciological model shows that the distribution of shear stress across different bedrock geometries form distinct patterns, such as the horizontal shear stress distribution across an incised parabolic trough that is embedded with infinitely wide ice slab (as shown in the figure on the frontpage).
Application of these models to Haig Glacier in the Canadian Rocky Mountains showed that similar geometric effects overshadow dynamical effects in glacier-retreat scenarios, thus indicating the minimal role of high-order physics for accurate predictions of the fate of Haig Glacier. Indeed, high-order and reduced-complexity models all predict that Haig Glacier ceases to exist by about 2080 under ongoing climate warming. High-order physics, however, turned out to be more important in glacier-advance scenarios at Haig Glacier, and simplifications in glacier dynamics may therefore not be applicable in this particular case and in other conditions, such as narrow or steep valley glaciers, glacier with higher flow rates or velocity gradients, and settings where basal sliding is an important component of ice flow.
In order to account for the influence of high-order physics that are missing in the reduced-complexity models, Adhikari calculated empirical correction factors for both dynamical flowline models and statistical volume-area scaling methods. Adhikari also provided new insights into the the volume-area scaling method by systematically quantifying the evolution of scaling parameters themselves. This helps to better understand the observed volume-area relations for ensemble of valley glaciers.
Surendra is a Nepalese national, explaining his fascination with glaciers. He is now a postdoctoral scholar at the California Institute of Technology, where he is exploring the influence of short-term hydrology (e.g, hydraulic-fractures) on ice sheet dynamics. He is also affiliated with Jet Propulsion Laboratory (JPL) for better understanding how solid Earth's response affects the ice sheet dynamics on decade-to-century time scales.
References
- Adhikari, S. and Marshall, S.J. 2012b: Glacier volume-area relation for high-order mechanics and transient glacier states, Geophys. Res. Lett., 39, L165052012GL052712 doi.
- Adhikari, S. and Marshall, S.J. 2011: Improvements to shear-deformational models of glacier dynamics through a longitudinal stress factor, J. Glaciol., 57, 206, 1003-1016 [8].
- Adhikari, S. and Marshall, S.J. 2012: Parameterization of lateral drag in flowline models of glacier dynamics, J. Glaciol., 58, 212, 1419-1432, [9].
- Adhikari, S. and Marshall, S.J. 2013: Influence of high-order mechanics on simulation of glacier response to climate change: insights from Haig Glacier, Canadian Rocky Mountains, The Cryosphere Discuss., 7, 1707-1748, [10]
Links
- Website: Ph.D. thesis for download.
XBeach Applied to Coral Reef
January 2013 - February 2013
XBeach is a two-dimensional model for nearshore waves and currents, dune erosion, overwashing and eventually breaching of barrier islands as a result of storms. The model has been developed with funding and support by the US Army Corps of Engineers, by a consortium of UNESCO-IHE, Deltares (Delft Hydraulics), Delft University of Technology and the University of Miami. Dano Roelvink, Ap van Dongeren and Ad Reniers are the current main developers, but over 60 scientists and engineers use the model. XBeach has been applied to many casestudies along the Dutch Coast, the US East Coast and worldwide and is increasingly used for the prediction of dune erosion and to evaluate coastal protection measures.
The recent study on the Nigaloo Reef in West-Australia shows that XBeach can be applied to study the hydrodynamics of fringing reef environments. These coral reefs have an important role offshore in the dissipation of wave energy of storms and swells. Simulations needed accounting for the higher roughness of the reef and adjustment the bottom friction parameters, but the modeled wave dynamics compared well against field measurements collected in 2009 along two arrays of wave buoys.
Many of the model developers and users are CSDMS members, but Xbeach also has its own vibrant open-source modeling community and platform. At the CSDMS Annual Meeting 2013, Ad Reniers will teach a clinic on XBeach!
References
- Dano Roelvink, Ad Reniers, Ap van Dongeren, Jaap van Thiel de Vries, Robert McCall, Jamie Lescinski, Modelling storm impacts on beaches, dunes and barrier islands, Coastal Engineering, Volume 56, Issues 11–12, November–December 2009, Pages 1133-1152, ISSN 0378-3839, doi:10.1016.
- Ap Van Dongeren, Ryan Lowe, Andrew Pomeroy, Duong Minh Trang, Dano Roelvink, Graham Symonds, Roshanka Ranasinghe, Numerical modeling of low-frequency wave dynamics over a fringing coral reef, Coastal Engineering, Volume 73, March 2013, Pages 178-190, ISSN 0378-3839, doi:10.1016/j.coastaleng.2012.11.004
Links
- Website: Open Source Model Community Model website
- Read more or download the 2011 XBeach Talk.
River Drainage Patterns Reveal Tectonic Deformation
January 2013
Dr. Sebastien Castelltort of the University of Geneva, with colleagues from ETH, Switzerland and the University of Grenoble apply a landscape evolution model, called Divide And Capture, DAC. DAC is developed by Sean Willett, Liran Goren, Frederic Herman and Jean Braun from ETH. It combines an analytic solution for first order channels with a numerical solution for higher order channels. DAC solves explicitly for the location of the channels’ divide and allows divide migration and channel capturing. The model uses Hack’s law with a stream power law to solve for channel slope. The model allows for experimental investigation of tectonic forcing and climate gradients.
In a recent paper in Nature Geoscience titled: “River drainage patterns in the New Zealand Alps primarily controlled by plate tectonic strain”, DAC was applied to investigate the effect of shear and rotation on evolving river drainage patterns. The model was set up to mimic drainage evolution in the Southern Alps of New Zealand at the convergence of the Australian-Pacific plate boundary.
The model experiments show that rivers along the steep and rainy westflank of the New Zealand Alps rapidly erode and self-organize to remain perpendicularly oriented to the mountain range axis. In contrast, the longer rivers along the eastflank tend to passively rotate with shearing, and record the large-scale plate tectonics over millions of years.
If drainage patterns indeed preserve fingerprints of the crustal strain, modeling could derive geological strain rates and help to identify seismic hazard zones. These model simulations suggests that 30-50% of the relative Australian-Pacific plate motions are distributed east of the prominent Alpine Fault, rather then just localized along the plate boundary.
References
- Castelltort, S., Goren, L., Willett, S.D., Champagnac, J-D., Herman., F., and Braun, J., 2012. River drainage patterns in the New Zealand Alps primarily controlled by plate tectonic strain, Nature Geoscience 5, 744-748, doi:10.1038/ngeo1582
Links
- Link to the author’s website: https://sites.google.com/site/sebastiencastelltort/
- Movie: Numerical Simulation of Southern Alps New Zealand Drainage Evolution
Modeling the Transition from Tidal Flat to Salt Marsh
August 2012 - December 2012
Tidal flats are low-lying intertidal landforms located along the fringes of shallow microtidal basins. Their evolution depends on the balance of sedimentation and erosional processes. Under certain wind wave and tidal current conditions, tidal flats may transition to higher-elevation salt marshes.
Point Tidal Flat is a stochastic point model designed to simulate the geomorphic response of a tidal flat to variable rates of sediment resuspension caused by wind waves and import of sediment by tidal currents. The model explores the balance between erosion and deposition that occurs through time as bottom shear stresses change relative to tidal flat elevation. Point Tidal Flat has been used to demonstrate that the transition from tidal flat to salt marsh occurs abruptly, rather than continuously, when the sediment input reaches a critical value related to the local wind climate and fetch length of a specific basin.
In a paper published in 2007 by Fagherazzi and others, Point Tidal Flat was applied to three different settings with both cohesive and non-cohesive substrates in the Venice Lagoon. Using inputs of total wave and tidal current shear stresses, and different fetch lengths of the three test settings, the model closely predicted the range of the equilibrium elevations required to maintain tidal flat stability. For example, the model calculated an equilibrium elevation of -0.6 m for the Northern Lagoon, which exactly matches the elevation measured in the field. This indicates that any increase in sediment input at this location may cause the tidal flat to become unstable and transition to a salt marsh. Another important aspect of the model is that it allows the separate study of the influence of tidal oscillations on tidal flat equilibrium. In micro- and mesotidal settings, where sediment resuspension occurs mainly by wind waves, the model results emphasize the importance of spring-neap tidal oscillations in generating shear stresses necessary for maintaining tidal flat stability.
References
- Fagherazzi, S., Palermo, C., Rulli, M.C., Carniello, L., Defina, A. 2007. Wind waves in shallow microtidal basins and the dynamic equilibrium of tidal flats. Journal of Geophysical Research, 112: F02024, doi:10.1029/2006JF000572.
- Fagherazzi, S., Carniello, L., D’Alpos, L., Defina, A. 2006. Critical bifurcation of shallow microtidal landforms in tidal flats and salt marshes. Proceedings of the National Academy of Sciences of the United States of America, 103 (22): 8337-8341, doi:10.1073/pnas.0508379103
Links
- Meet the author:Sergio Fagherazzi's homepage
- Read more or download the Point Tidal flat model.
2011 Mississippi flood deposited large amounts of sand
September - December 2012
Coastal wetland loss in Louisiana proceeds at dramatic rates and has fueled discussions in the science and engineering community on the potential of diverting sand from the Mississippi River into the nearby wetlands to restore and build new land. The 2011 flood in the Mississippi River was the largest flood since the historic 1927 flood, which prompted the construction of the Bonnet-Carre spillway. The spillway has been used approximately once every decade in the 20th century. During the 2011 flood the US Army Corps of Engineers opened the Bonnet-Carre Spillway from May 9th to June 20th and on average 6,010 m3/sec of water was drained towards Lake Pontchartrain, skimming the uppermost 5 m of the river watercolumn. This diversion provides new insights in the efficiency of river water and sediment diversions for mitigation of wetland loss.
Dr. Nittrouer and colleagues of the University of Illinois, Urbana-Champaign published a paper in Nature Geoscience recently, which presents their field data and modeling analysis of the amount of sediment diverted from the main Mississipppi river channel into the spillway area. The image shows the extensive sand deposits near the spillway, tire tracks provide a sense of scale (image courtesy: J. Nittrouer).
The authors find 4.9 * 106 m3 of deposited fine sand, the sand proved to be similar to the sandbar on the adjacent riverbottom. If one calculates average concentration over the 5 m water column with a Rouse model, and subsequently assumes a constant flux over the duration of the spill the predicted volume of sediment deposition would be ~ 5.1 * 106 m3. The authors subsequently compare their modeled concentrations with upstream and downstream measurements of concentrations of sand load in the Mississippi River and estimate that as much as 31-46% of the potential transported load has been diverted, a much higher proportion than would be expected based on the skimming of the uppermost water column. Nittrouer and colleagues point out that the relatively high sand load may have been sourced locally from large subaqeous sandbar located directly adjacent to the spillway in the Mississippi River. They conclude that water and sand diversion structures or spillways can be strategically optimized to deliver sand to the wetland areas relatively more efficiently than previously anticipated.
References
- Jeffrey A. Nittrouer, James L. Best, Christopher Brantley, Ronald W. Cash,Matthew Czapiga, Praveen Kumar, Gary Parker. 2012. Mitigating land loss in coastal Louisiana by controlled diversion of Mississippi River sand. Nature Geoscience, 5, 22 July 2012, 534-537. DOI:10.1038/NGEO1525 10.1038/NGEO1525
Links
- Link to movies of additional diversions during the Mississippi flood of 2011: Watch levee breach movie and download it from the EKT repository
- Additional Questions? Jeff Nittrouer contact information
Tucker receives Ralph Alger Bagnold Medal 2012
June 2012 - July 2012

Ralph Alger Bagnold (1896-1990) started out his career as a royal military engineer, and spend much of his military career in North Africa and India exploring the desert and pioneering desert travel. He returned to science in 1944, and is most known in the earth sciences community for his contributions to the understanding of sand transport. Bagnold made significant contributions to the understanding of sedimentary structures such as sand dunes, ripples and sandsheets. He developed the dimensionless Bagnold number and well-known Bagnold formula, which relates sand transport to windspeed. Bagnold's passion for science never left him and he continued to publish scientific papers into his nineties. The R.A. Bagnold Medal commemorates his scientific achievements.
We quote the official European Geoscience Union statement on the 2012 Ralph Alger Bagnold Medal to Gregory Tucker:
“Greg Tucker has made critical contributions to a large number of topics in geomorphology. He has been one of the pioneers in the use of two-dimensional landscape evolution models. He did not use them to study a particular issue or problem, but rather to explore how basic properties of geomorphic systems could be related to the landforms these systems produced, over a wide range of both temporal and spatial scales. By doing so, he has convincingly shown that geomorphic models that integrate all relevant processes can indeed make a decisive difference in furthering our understanding of landscape evolution. His work was seminal in showing how different processes may interact in order to produce, in some cases, unexpected and counterintuitive results, even when large landforms are considered. A prime example of this is one of his first publications on the modeling of the erosional dynamics of escarpments where he demonstrates that supply-limited conditions are a necessary prerequisite to produce high, long-lived escarpments. Widely cited modeling work of a few years later that he did together with Rafael Bras demonstrated that different assumptions on runoff and sediment production on hillslopes do indeed produce distinctive morphologies and drainage density-relief relationships. Together with Erkan Istanbulluoglo and others he also showed how vegetation potentially modifies long-term landscape response, a fact that is all too often forgotten in long-term landscape studies. Tucker’s contributions, however, are not limited to the study of soil-hillslope-drainage basin interactions. Together with Rafael Bras and others he went on to study the effects of event variability on landscape development, a welcome divergence of the steady-state assumptions that are used in most studies (Tucker and Bras, 2000). Variability has been an important theme in his work ever since Tucker conclusively showed that many aspects of drainage basin behaviour cannot be properly understood if temporal variability in the driving forces is not accounted for. Tucker has not modelled in isolation: throughout his career he has been interacting with field geomorphologists and he has been confronting models with empirical data wherever possible. This led to insightful papers on the factors controlling the development of arroyos (Tucker et al., 2006) as well as insights which may help guiding future erosion studies with cosmogenic nuclides in landslide-prone areas and the interpretation of geoarcheological archives. Finally, Tucker should not only be honoured for his important scientific contributions to geomorphology (the account above is but a small sample) but also for his clear scientific writing. Tucker’s papers excel in clarity, whereby things are looking simple, perhaps simpler than they really are. Many young scientists have been attracted to the theoretical aspects of our discipline through the papers of Tucker, and through the way he has made modeling tools like “Golem” and “Child” trademarks in the geomorphic community.”
References
- Tucker, G.E., and Bras, R.L. (2000) A Stochastic Approach to Modeling the Role of Rainfall Variability in Drainage Basin Evolution, Water Resources Research, 36(7), pp. 1953-1964.
- Istanbulluoglu, E., Bras, R.L., Flores-Cervantes, H., and Tucker, G.E. (2005) Implications of bank failures and fluvial erosion for gully development: Field observations and modeling. Journal of Geophysical Research - Earth Surface, v. 110, no. F1, F01014, doi:10.1029/2004JF000145.
- Gasparini, N.M., Bras, R.L., and Whipple, K.X. (2006) Numerical modeling of non-steady-state river profile evolution using a sediment-flux-dependent incision model, in Tectonics, climate and landscape evolution, S. Willett, N. Hovius, M. Brandon & D. Fisher, eds., GSA Special Paper 398, Penrose Conference Series, Geological Society of America, pp 127-141.
And for an overview of the field:
- Tucker, G.E., and Hancock, G.R. (2010) Modelling landscape evolution: Earth Surface Processes and Landforms, v. 35, p. 28-50.
Links
- Meet the Terrestrial Working Group Chair: Greg_Tucker
A sediment load model for the world’s drainage basins
June 2012 - July 2012
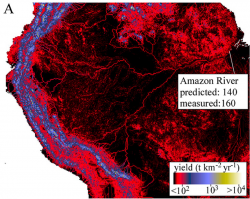
This model predicts suspended sediment loads, which are critical for assessment of land-use, soil erosion and river sediment discharge. In turn, the incoming sediment greatly affects the state of deltas at the downstream end. The presented model is spatially-distributed, and runs over a 5 arc minute SRTM digital elevation model, which allows better understanding of storage of sediment along its way to the ocean on the decadal timescale. The resolution of the data makes the model appropriate for medium-scale catchments (>1000-10,000 km2) and larger river basins.
One new aspect of the recently published model is the inclusion of vegetation cover by using a Leaf Area Index derived from a gridded remotely-sensed dataset of a Normalized Difference Vegetation Index from 1981-2006. The model then assumes an inverse, but stochastic, relationship between Leaf Area Index and soil detachment, i.e. more leaf layers lead to less erosion potential. Dr. Pelletier innovatively uses a new global datasets for soil texture: the Harmonized World Soils Map (see more info in the CSDMS data repository: Data:HWSD to constrain grainsize parameters which impact efficiency of river transport.
The paper compares model predictions with existing river sediment load databases for natural or pre-dam conditions. The author concludes that the presented simple regression model with two free parameters performs relatively well. Just using one example, the Amazon River shows most of the basin sediment yield originating from the narrow Andes Mountain Range. The model predicts a yield of 140 t/km2 per year close to the Amazon river mouth, whereas the measured yield is 160 t/km2 per year. The author extensively discusses model shortcomings and potential improvements ranging from inclusion of reservoir and dam data, as well as incorporating quantitative relationships for uplift rates and landslides.
References
- Pelletier, J.D., 2012, A spatially distributed model for the long-term suspended sediment discharge and delivery ratio of drainage basins. Journal of Geophysical research, 117, F02028, doi:10.1029/2011JF002129.
Links
- Meet the author:Jon Pelletier' homepage
Elwha River restoration, the largest dam removal project in North America
February 2012 - April 2012
Since the dams were built the Elwha River delta has experienced shoreline erosion, reduced sediment available to be moved along the coast via longshore transport, and a coarsening of the delta substrate. Gelfenbaum and others’ simulations predict post dam removal shoreline erosion rates may slow and even stop. A range of sediment sizes will accumulate at rates of up to 1 cm per year near the river mouth. Interestingly while sedimentation rates diminish away from the mouth of the river the tip of a nearby spit of land, Ediz Hook is modeled to receive increased sedimentation rates of approximately 0.5 cm per year. The stability of this hook is critical to the city of Port Angeles, that relies on the natural embayment created by it to provide a calm harbor for ships using the port of Port Angeles, and for others that use it to wait for favorable tides before proceeding on to other ports throughout the Puget Sound region.
References
- Gelfenbaum, G., Stevens, A.W., Elias, E., and Warrick, J.A., 2009. Modeling sediment transport and delta morphology on the dammed Elwha River, Washington State, USA. Proceedings of Coastal Dynamics 1-15, doi:10.1142/9789814282475_0109
Links
- A range of USGS publications on the Elwha River, including Gelfenbaum et al 2009 can be found at http://walrus.wr.usgs.gov/elwha/publications.html
- Link to animation of suspended sediment plume over 72 hour period http://pubs.usgs.gov/sir/2011/5120/5.13/player.html
Reduced-Complexity Model of Delta Formation
February 2012 - May 2012
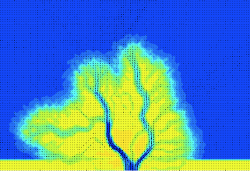

Man Liang, of St Anthony Falls Laboratory, University of Minnesota received the 2011 Student Modeler Award for her research titled: ‘A Reduced-Complexity Channel-Resolving Model for Delta Formation.
Liang developed a new model for delta formation, capable of simulating delta channel bifurcation and channel avulsion. The model has probabilistic rules for routing sediment and water packages with a ‘random-walk’ algorithm. The unique aspect of Liang’s model is that one of the rules to drive the probability for the ‘random-walk’ is a simplified version of the shallow water equations. This model design allows a direct hydrodynamic feedback upon an otherwise rule-based model. Liang comments: 'There may be limited physics presented by these simple rules, but the model is designed to be flexible and each building block can be 'upgraded' individually'.
Early model simulations show delta channels freely migrating over a delta plain. Several channels are active at the same time and one distributary channel can slowly evolve to be dominant over time. Comparisons of basic geometry metrics (as proposed by Wolinsky et al., 2010) the roughness of the shoreline generated by the model and the fractal properties of the channel networks compare remarkably well to the young, real-world Mossy delta, which is part of the Saskatchewan delta complex.
Presently, this model is written in Matlab and runs in a few minutes for short experiments to a few hours for higher resolution grids and longer timescales. 'Future plans are to improve upon the existing version and transfer it to a faster and more compliant language and even perhaps to set it up such that it can be run parallel' says Liang.
Model movies:
Links
Watch Man Liangs talk at the CSDMS meeting. click here
Irreversible Peatland Subsidence Depends on Water Management
November 2011 - January 2012
Understanding subsidence of peat-rich coastal areas due to bio-oxidation is of great importance, because of increased risk of flooding with rapid sea level rise, because of saltwater intrusion from nearby estuaries and lagoons, and because of net CO2 production with oxidation.
Detailed field observations of ground level and meteorological and soil conditions on peat-rich farmland nearby the Venice Lagoon in Italy over 2002-2006 show that with wetting and drying due to rainstorms significant, but reversible subsidence occurs. Peat expands with wetting and decreases as the water table drops subsequently. These elastic deformations due to pore pressure variations amount upto 5 mm over a few days to 2 weeks, and can be well modeled with a new numerical approach presented in the Journal of Geophysical Research paper (Zanello et al., 2011).
Irreversible loss over the period of measurement amounts upto 30 mm in 4 years. Subsidence has been ongoing over the last 70 years after this area was claimed for agricultural use. The exposed foundation of the small bridge on the photo illustrates how cumulative subsidence can be >1m, it now prohibits efficient drainage. A model quantifies the relationship between peat layer properties, water table (management) and temperature to predict bio-oxidation rates. It was found that most oxidation happens due to dry, warm conditions. The simulations indicate that for a given peat soil, oxidation is mostly influenced by a low water table levels. This result has important implications for hydrological management of peaty lowlands, less subsidence will occur under waterlogged conditions.
References
- Zanello, F., Teatini, P., Putti, M., Gambolati, G., 2011. Longterm peatland subsidence: experimental study and modeling scenarios in the Venice coastland. Journal of Geophysical Research, 116, F040002, doi:10.1029/2011JF002010
SPARROW
November 2011 - December 2011
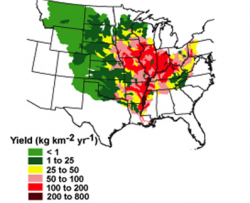
Importantly, SPARROW is designed to predict changes in water quality that may result from management actions or changes in land use. This model is evolving into a decision-support system for water quality managers. Specifically, SPARROW can be used to link water quality and constituent sources. It can track the transport of constituents to streams and downstream receiving waters, such as estuaries and the coastal zone; the associated figure shows a nice example of modeling the phosphate flux in the Mississippi River Basin that is transported all the way to the Gulf of Mexico.
SPARROW models use regression methods, it needs the observed data of water discharge and solute fluxes to then estimate regression model coefficients that minimize the error between predicted and observed values of annual constituent loads at fixed monitoring sites. This methodology allows exploration of variables that show statistically significant relations to spatial patterns in annual nutrient loads for example. Thus SPARROW can be an objective means of evaluating the relative importance of various watershed charac¬teristics and sources of constituents as predictors of water-quality. Managers can for example assess whether discharges from point sourcesare a stronger predictor of water quality and load than nonpoint-source loads, such as runoff of manure from agricultural areas.
The CSDMS community has several groups working with SPARROW predictions. The Chesapeak Bay modeling community benefits from regional SPARROW predictions and Prof. Jon Goodall, chair of the CSDMS Hydrology Working Group, just published a new software library, PySPARROW, to go with SPARROW to predict transport of nitrogen through a river basin.
References
- Alexander, R.B., Smith, R.A., Schwarz, G.E., Boyer, E.W., Nolan, J.V., Brakebill, J.W., 2008, Differences in phosphorus and nitrogen delivery to the Gulf of Mexico from the Mississippi River basin. Environmental Science & Technology, 42, 3, 822–830, http://pubs.acs.org/doi/abs/10.1021/es0716103.
- Goodall, J., Fay, J., Bollinger Jr., D. 2010. A software library for quantifying regional-scale nitrogen transport within river basin systems, Environmental Modelling. 25, 12, 1713-1721, Doi: 10.1016/j.envsoft.2010.04.007.
- Hoos, A.B., McMahon, G. 2009, Spatial analysis of instream nitrogen loads and factors controlling nitrogen delivery to streams in the southeastern United States using Spatially Referenced Regression on Watershed Attributes (SPARROW) and regional classification frameworks, Hydrological Processes, Doi: 10.1002/hyp.7323.
Links
Ongoing development and research is reported on the SPARROW USGS Model website: http://water.usgs.gov/nawqa/sparrow/
Model metadata on CSDMS: https://csdms.colorado.edu/wiki/Model:SPARROW
The new software library PySPARROW is available at:
http://code.google.com/p/pysparrow
New Modeling Textbook
September 2011 - October 2011
The newly published textbook: “Mathematical Modeling of Earth's Dynamical Systems: A Primer” by Slingerland and Kump helps earth scientists build essential skills to represent Earth surface processes with mathematical and computational models.
The book aims at upper-level undergraduate students, graduate students, and scientists who want to learn how to abstract complex earth systems into sets of dynamic equations. It is clear that the authors do aim at an audience that is familiar with the principles of physics, chemistry, and geology, and expect some background in differential and integral calculus. But the authors stress that little prior modeling experience is needed to use this book; they want to instill a philosophy of science that values quantification as a way of gaining insight.
That philosophy rings true. The authors step aspiring modelers systematically through quantitative problem solving process. Firstly, get the physical picture clear while recognizing domains of interest and key factors, then write down the mathematical laws, be aware of the restrictive assumptions, check your units and boundary conditions and lastly verify, validate and solve your model.
Various relevant examples of processes and systems are provided with increasing complexity over the chapters. Slingerland and Kump offer problems over the entire Earth System Science domain in choosing groundwater flow, coastline evolution, sediment transport, radioactive decay, and carbon flux modeling problems as their rich set of examples. Every chapter has modeling assignments for eager modelers to try their newly acquired insight, or for teaching faculty to assign to their students. Slingerland and Kump are the “top chefs” who present a cookbook with their favorite basic recipes for earth surface modelers. Taste these, feed the inner quantitative modeler and enjoy.
The Princeton University Press quotes: "Written by two of the leading researchers in the field, Mathematical Modeling of Dynamical Systems is a must-read for all geoscientists, and not just students. This excellent primer offers bite-size gems of insight into the world of quantitative geosciences applications, covers both mathematical and modeling concepts, and offers practical exercises to build expertise. Course notes and methodologies will be improving across our academies."--James P. M. Syvitski, executive director, Community Surface Dynamics Modeling System
References
- Slingerland, R., Kump, L., 2011. Mathematical Modeling of Earth's Dynamical Systems: A Primer.
Princeton University Press. ISBN 978-0-691-14514-3.
Links
SNAC
August 2011 - September 2011
SNAC - StGermaiN Analysis of Continua - is an explicit Lagrangian finite difference code for modeling a finitely deforming elasto-visco-plastic solid in three dimensions. SNAC can solve momentum and heat energy balance equations in 3D solids with complicated rheology. Lagrangian description of motion adopted in SNAC makes it easy to monitor surface deformation during a crustal or continental-scale tectonic event as well as introduce surface deformation into other earth surface processes models. The example shows calculated strain distribution over a deformed block, of 100 by 100 by 20 km. The modeled block is undergoing oblique rifting, and the resulting warped surface topography is shown.
SNAC simulations helped explain that the intricacies of orthogonal topographic and fault patterns characteristic of mid-ocean ridge surfaces result the competing tension of cooling of young oceanic crust and spreading. The ratio between the tension due to thermal stress and the spreading-induced tension determines whether ridge segments overlap and bend towards each other, or whether they are connected by a transform fault.
SNAC has been released under the GNU General Public License and has recently been contributed to the CSDMS repository. The model can be run on a single processor as well as on multiple processors. Choi presents performance details with his source code.
Reference
- Choi, E., L. Lavier, and M. Gurnis (2008), Thermomechanics of mid-ocean ridge segmentation, Phys. Earth Planet. Inter., 171, 374-386, (dx. doi. org/ 10. 1016/ j. pepi. 2008. 08. 010).
Links
Meet the developer: http://www.ldeo.columbia.edu/~echoi/
Ongoing development is reported on the SNAC Model website: http://www.geodynamics.org/cig/software/snac/
Where do Salmon thrive?
June 2011 - July 2011
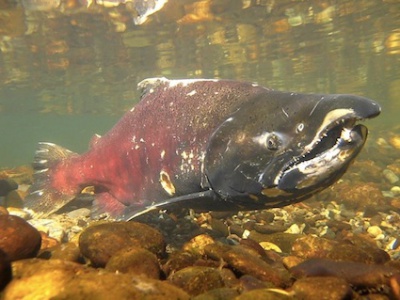
The Merced River in the Central Valley of California has been highly impacted by damming, gravel mining and placer mining over the last 150 years. River restoration projects along the Robinson Reach of the Merced River have focused on restoring the river to more natural conditions by excavating a 2.25km long single-thread, meandering channel with riffles and pools. Restoration was completed in January 2002. Dams in the upstream areas still dominate the flow conditions, with short releases of high water and mostly sustained low water. Two more extensive spring flood events with sustained overbank flows for several weeks occurred post-restoration.
A team of scientists from University of California, Santa Barbara, the California Polytechnical State University and the University of Wyoming used repeat observations of channel morphologies to condition flow simulations with FastMech-the Multidimensional Surface Water Modeling System developed by the USGS (a.o. Barton et al., 2005). Harrison and co-authors coupled the flow simulations to habitat criteria for Salmon spawning and rearing. Salmon prefer shallow riffles of ~50 cm for spawning, whereas optimal young salmon rearing habitat is in pools greater than 75 cm depth with lower flow velocities. Model simulations showed that substantial bar growth and migration occurred during the two flood events. Pointbars that were formed during flood are now favorable habitats at low flows, especially for spawning; 70% of the restored river stretch now has good habitat conditions for spawning. The coupled model predictions show that the restored channel has still less optimal conditions for Salmon rearing. Juvenile salmon need small-scale morphological features, which slow down the flow velocity.
References
- Harrison, L. R., C. J. Legleiter, M. A. Wydzga, and T. Dunne (2011), Channel dynamics and habitat development in a meandering, gravel bed river, Water Resour. Res., 47, W04513, doi:10.1029/2009WR008926.
- Barton, G. J., R. R. McDonald, J. M. Nelson, and R. L. Dinehart (2005), Simulation of flow and sediment mobility using a multidimensional flowmodel for the white sturgeon critical habitat reach, Kootenai River near Bonners Ferry, U.S. Geol. Surv. Sci. Invest. Rep., 2005‐5230.
Links
SedBerg
June 2011 - July 2011
Tidewater glaciers advance sometimes by kilometers a year, and icebergs calve off glacier fronts into fjords. As an example, Kangerdlussuaq glacier in East Greenland advanced 5-6 km/year between 1966 – 1995, and accelerated to reach rates of 13-15 km/yr. Calving results in tremendous fluxes of icebergs that drift in the fjords and slowly melt, thereby releasing freshwater and all the sediment carried within the glacier ice. SedBerg developed by dr. Ruth Mugford of Scott Polar Research Institute simulates calving as a stochastic process, it generates a log-normal distribution of icebergs to be released into a fjord. A unique aspect of the SedBerg Model is that it takes into account sediment fluxes generated by icebergs. Newly formed icebergs inherit sediment as both basal debris (about 50% sediment concentration by volume), whereas the bulk of the berg consists of englacial ice, and only carries very low sediment concentrations of less than 0.001% by volume. Iceberg drift through the fjord is modeled by applying the equation of motion; thus bergs move as a function of wind and water drag and waves. Sediment melts out based on solar radiation and variable ocean temperature. The model was tested for Kangerdlussuaq fjord, where there are datasets of ocean temperature, waves and tidal currents as well as calving rates. The model shows that roughly 20% of representative icebergs melt while in Kangerdlussuaq fjord, whereas around 75% of the icebergs leave the fjord to reach the continental shelf. Model predictions of sedimentation rates over the last 1500 years demonstrated a reasonable match with a fjord bottom core. Model experiments emphasize that glaciological conditions, such as calving rate and the presence or absence of basal sediments dominate the signal, whereas air and water temperature changes results in a smaller response.
Reference
- Mugford, R. I., and J. A. Dowdeswell (2010), Modeling iceberg-rafted sedimentation in high-latitude fjord environments, J. Geophys. Res., 115, F03024, doi:10.1029/2009JF001564.
Links
Meet the developer: https://www.homerton.cam.ac.uk/node/24792
Download this model from CSDMS repository: Model:SedBerg
Vote to prioritize this model to be incorporated into CMT here...
Retreating Arctic Coasts
April 2011 - June 2011
The coastline in Arctic regions reacts to climate change with widespread increased erosion by 0.5 m per year. Coastal change is particularly dramatic in the Laptev, East Siberian and Beaufort Seas, where coastal erosion rates reach more than 14 m/year. Since around a third of the world’s coasts are located in the Arctic permafrost, coastal erosion may affect enormous areas in future. In general Arctic coasts react more sensitively to global warming than coasts in the mid-latitudes. Up to now these coasts have been protected against the eroding force of the waves, and warm sea water by sea ice cover. Due to the continuous decline in sea ice area extend, this protection is jeopardized.
Two thirds of the Arctic coasts consist of frozen sediments. And precisely these coasts are extremely hard hit by erosion. As a rule, Arctic regions are quite thinly populated. However, as nearly everywhere in the world, the coasts in the far north are important axes for economic and social life. The growing need for global energy resources as well as increasing tourism and freight transport additionally intensify anthropogenic influence on the coastal regions of the Arctic. For wild animal stocks, like the great caribou herds of the north, and the widespread freshwater lakes near the coast progressive erosion brings about significant changes in ecological conditions. More than thirty scientists from ten countries were involved in preparing the 170-page status report entitled “State of the Arctic Coast 2010”. The study was initiated and coordinated by the International Arctic Science Committee (IASC), the international joint project Land-Ocean Interactions in the Coastal Zone (LOICZ), the International Permafrost Association (IPA) and the Arctic Monitoring and Assessment Programme (AMAP) working group of the Arctic Council.
Links
- http://www.arcticcoasts.org/
- PDF of report
- Article in 360 environment: As arctic sea ice retreats storms take toll on the land
Movies of coastal retreat can be found in the CSDMS EKT repository:
Delft3D
April 2011 - May 2011
Delft3D is a 3D modeling suite, originally developed for engineering applications, to investigate hydrodynamics, sediment transport and morphology and water quality for fluvial, estuarine and coastal environments. As of January 1st, 2011, the Dutch research and consulting institute Deltares announced that the Delft3D flow (FLOW), morphology (MOR) and waves (WAVE) modules are available in open source. Delft3D software has a number of open-source pre and post-processing tools that are just coming online, or are under development to become open source in 2012.
However, the three core engines of Delft3D are all now already available to users for new development.
The FLOW module is the engine of Delft3D. It simulates multi-dimensional (2D or 3D) hydrodynamics, to calculate non-steady flow and transport phenomena resulting from tidal and meteorological forcing on a curvilinear, boundary fitted grid or spherical coordinates. The morphology, i.e. MOR, module computes sediment transport for both suspended and bed load and morphological changes for an arbitrary number of cohesive and non-cohesive fractions. Currents and waves act as driving forces and a wide variety of transport formulae have been incorporated. For the suspended load this module connects to the 2D or 3D advection-diffusion solver of the FLOW module. An essential feature of the MOR module is the dynamic feedback with the FLOW and WAVE modules, which allow the flows and waves to adjust themselves to the local bathymetry and allows for simulations on any time scale from days (storm impact) to centuries (system dynamics). It can keep track of the bed composition to build up short stratigraphic records.
Reference
- Lesser, G., Roelvink, J., Van Kester, J. & Stelling, G. Development and validation of a three-dimensional morphological model. Coast. Eng. 51, 883_915 (2004).
- Dastgheib, A., Roelvink, J. A. & Wang, Z. B. Long-term process-based morphological modeling of the Marsdiep tidal basin. Mar. Geol. 256, 90_100 (2008).
- van Maren, D. S. Grain size and sediment concentration effects on channel patterns of silt-laden rivers. Sedim. Geol. 202, 297_316 (2007).
- Marciano, R., Wang, Z. B., Hibma, A., de Vriend, H. J. & Defina, A. Modeling of channel patterns in short tidal basins. J. Geophys. Res. 110, F01001 (2005).
Links
Join the Delft3D open source user community and download the code:
Boom-and-bust cycles of barrier island retreat
December 2010 - April 2011
Barrier Islands, the low-lying sandy strips separated from the coast by a lagoon, are a favorite location to build beach resorts. Whereas a natural barrier system would steadily migrate with sea-level rise, barriers evolution is now dynamically coupled to human action to prevent storm erosion. CSDMS scientist Dylan McNamara, currently at the University of North Carolina, has been on the forefront of coupled modeling of barrier island physical processes and human factors such as hazard mitigation driven by market development.
McNamara’s model shows that barrier island are maintained at unnaturally low elevations and that this situation filters out the frequent small responses to storm events, but that the inherently instability creates longterm boom-and–bust cycles of barrier island retreat.
References
- McNamara, D. and Werner, B., 2008. Coupled Barrier Island-Resort Model: 1. Emergent instabilities induced by strong human-landscape interactions. Journal of Geophysical Research – Earth Surface, 113, F01016, doi:10.1029/2007JF000840.
- McNamara, D. and Werner, B., 2008. Coupled Barrier Island-Resort Model: 2. Tests and predictions along Ocean City and Assateague Island National Seashore, Maryland. Journal of Geophysical Research – Earth Surface, 113, F01017, doi:10.1029/2007JF000841.
Links
February 2011 - April 2011
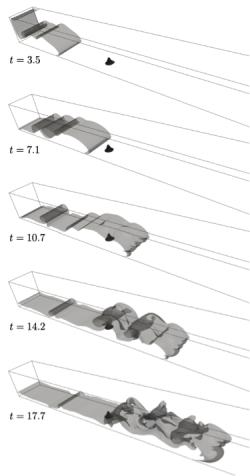

TURBINS
Turbidity currents are sediment-loaded, underwater currents that flow along the seafloor slope, and due to their rare and destructive nature, field observation are notoriously difficult. Consequently, numerical models are key tools for the exploration of turbidity current dynamics. TURBINS (by Mohamad Nasr-Azadani of the Univ. of California, winner CSDMS 2010 student modeler award) is such a model; capable of modeling turbidity currents interacting with complex topographies both 2D and 3D.
A turbidity current is a current of dense, sediment-laden water moving underwater along a seafloor slope. These currents move because it has a higher density than the ocean water through which it flows. The driving force of a turbidity current is obtained from the sediment, which renders the turbid water heavier than the clear water above. Seafloor turbidity currents maybe triggered by earthquakes , slumping and sediment laden rivers.
Turbidity currents can be maintained for hours or even days, transport many km3 of sediment, and propagate over distances up to 1,000km. The sediment deposits generated by these currents, known as turbidites, extend over tens or even hundreds of kilometers along the bottom of the ocean, and they frequently are hundreds of meters deep. The interaction between turbidity currents and their deposits via erosion and deposition results in the formation of pronounced topographical features on the seafloor, such as channels, gullies, levees and sediment waves.
Due to the infrequent and unpredictable occurrence of turbidity currents in remote, deepwater areas, and their destructive nature, field data regarding their structure and evolution are very difficult to obtain. Consequently, in addition to laboratory experiments, high-resolution simulations have become an important tool for the exploration of their dynamics.
The computational effort required for turbidity current and gravity flow simulations is largely a function of the Reynolds number Re = UH/ν, where U represents the front speed, H is a measure of the current height, ν denotes the kinematic viscosity of the fluid, usually water. Direct Navier-Stokes simulations typically can reach Reynolds numbers of Re~(103 − 104), which makes it impossible to simulate geophysical turbidity currents in the ocean, which can reach highly turbulent flows with Re ~(109). These orders of magnitude make clear the need for large-scale, massively parallel simulations, combined with accurate turbulence modeling efforts.
The present investigation describes the development and validation of a computational code called TURBINS (TURBidity currents via Immersed boundary Navier-Stokes simulations), which addresses many of the above needs. TURBINS, a highly parallel code written in C, is capable of modeling gravity and turbidity currents interacting with complex topographies in two and three dimensions. Accurate treatment of the complex geometry, implementation of an efficient and scalable parallel solver, i.e. multigrid solver via PETSc and HYPRE to solve the pressure Poisson equation, and parallel IO are some of the features of TURBINS. An example is shown in Figure 1, a gravity flow hits an obstacle on its flowpath and 3D vortices appear the the front and wake of the current.
TURBINS enables us to tackle problems involving the interaction of turbidity currents with complex topographies. It provides us with a numerical tool for quantifying the flow field properties and sedimentation processes, e.g. energy transfer, dissipation, and wall shear stress, which are difficult to obtain even at laboratory scales. By benefiting from massively parallel simulations, we hope to understand the underlying physics and processes related to the formation and deposition of particles due to the occurrence of turbidity currents.
Reference
- M.M. Nasr-Azadani, E. Meiburg, TURBINS: An immersed boundary, Navier-Stokes code for the simulation of gravity and turbidity currents interacting with complex topographies, Computers & Fluids 45, 14-28 (2011), doi:10.1016/j.compfluid.2010.11.023.
Links
Read More on the project of parallel modeling of Turbidity Currents
TopoFlow, a spatially-distributed hydrologic model
December 2010 - January 2011
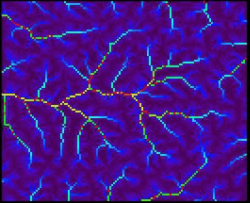
TopoFlow is a 2D spatially-distributed hydrologic model that simulates physical processes in a watershed to predict how various hydrological variables evolve: snowmelt, precipitation, evapotranspiration, infiltration, channel/overland flow, shallow subsurface flow and flow diversions. It allows investigation of hydrological responses to climatic forcings. Time evolution for single pixels (like hydrographs), sets of user-selected pixels, or entire grids (as animations) are all supported as output options. TopoFlow 3.0 is developed by Scott Peckham and became available in 2010 as a set of over 20 plug and play components that can be used with the CSDMS Modeling Tool (CMT). The components, can be either run as standalone or linked, and have successfully been linked to other models like a valley glacier model, GC2D. The model can be run for a specific storm event or up to a year or longer if necessary. Test datasets are available when using the CMT tool by choosing one of the example configurations in the file menu. Each of the TopoFlow components in the CMT has a configure button, so parameter settings can be changed easily. Help documentation is written and can be started from the CMT to guide the user in setting the various parameter if needed.
Reference
Peckham, S.D., 2008. Geomorphometry and spatial hydrologic modeling (Chapter 25), In: Hengl, T. and Reuter, H.I. (Eds), Geomorphometry: Concepts, Software and Applications. Developments in Soil Science, vol. 33, Elsevier, 579-602 pp.
Links
TopoFlow model questionnaire
Source code (python as well as IDL)
More info on the CSDMS Modeling Tool (CMT)
