Labs portal1: Difference between revisions
No edit summary |
No edit summary |
||
| Line 2: | Line 2: | ||
<br> | <br> | ||
<br> | <br> | ||
OLD LABS REPOSITORY. DO NOT CHANGE THESE FILES. WE ARE MOVING LABS INTO OUR NEW PORTAL. THE LABS BELOW ARE ALREADY MOVED TO THE NEW PORTAL. | |||
<BR><BR> | |||
{|{{Educational_portal_layout}} | {|{{Educational_portal_layout}} | ||
! colspan="2"| <b>Labs</b> | ! colspan="2"| <b>Labs</b> | ||
Revision as of 12:50, 1 April 2020
OLD LABS REPOSITORY. DO NOT CHANGE THESE FILES. WE ARE MOVING LABS INTO OUR NEW PORTAL. THE LABS BELOW ARE ALREADY MOVED TO THE NEW PORTAL.
| Labs | |
|---|---|
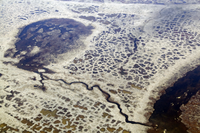 |
Permafrost Modeling: where does permafrost occur?
What is permafrost and how do you make a first-order prediction about permafrost occurrence. This is lesson 1 in a mini-course on permafrost, this lab uses the Air Frost Number and annual temperature data to predict permafrost occurrence. Model permafrost occurence in a Jupyter Notebook |
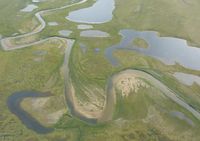
| Permafrost Modeling: the Active Layer
Explore what is active layer depth and the effects of snow and soil water content on permafrost. This is lesson 2 in a mini-course on permafrost. It employs a 1D configuration of the Kudryavtsev model. Model active layer thickness and its controls | |
 |
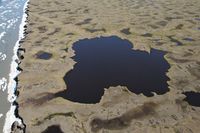
Permafrost Modeling: making maps from gridded climate data
Using the Frost number code and grids of climate input data, one can make predictions of permafrost occurrence over the last century in Alaska. This is lesson 3 in a mini-course on permafrost. Create maps of permafrost using climate reanalysis grids in WMT |
 |
Permafrost Modeling: looking at future permafrost with climate models
Using the Frost number code and grids of climate model input data (CMIP5), allows you to map predictions of permafrost occurrence. This is lesson 4 in a mini-course on permafrost. What would permafrost look like at the end of the 21st century? |
