Annualmeeting:2017 CSDMS meeting-113: Difference between revisions
No edit summary |
No edit summary |
||
| (7 intermediate revisions by one other user not shown) | |||
| Line 29: | Line 29: | ||
}} | }} | ||
{{CSDMS meeting abstract title temp | {{CSDMS meeting abstract title temp | ||
|CSDMS meeting abstract title=Temporal variability in | |CSDMS meeting abstract title=Temporal variability in bed elevation near Shoal E, Cape Canaveral shoals | ||
}} | |||
{{CSDMS meeting authors template | |||
|CSDMS meeting coauthor first name abstract=Peter | |||
|CSDMS meeting coauthor last name abstract=Adams | |||
|CSDMS meeting coauthor institute / Organization=University of Florida | |||
|CSDMS meeting coauthor town-city=Gainesville | |||
|CSDMS meeting coauthor country=United States | |||
|State=Florida | |||
|CSDMS meeting coauthor email address=adamsp@ufl.edu | |||
}} | |||
{{CSDMS meeting authors template | |||
|CSDMS meeting coauthor first name abstract=Arnoldo | |||
|CSDMS meeting coauthor last name abstract=Valle-Levinson | |||
|CSDMS meeting coauthor institute / Organization=University of Florida | |||
|CSDMS meeting coauthor town-city=Gainesville | |||
|CSDMS meeting coauthor country=United States | |||
|State=Florida | |||
|CSDMS meeting coauthor email address=arnoldo@ufl.edu | |||
}} | }} | ||
{{CSDMS meeting abstract template | {{CSDMS meeting abstract template | ||
|CSDMS meeting abstract= | |CSDMS meeting abstract=The increasing demand for sediments as source material for beach nourishment projects highlights the need to understand inner-shelf transport dynamics. At cape-related shoals, from where sedimentary materials are customarily extracted, the variability in particulate transport and related bedform evolution are not well understood. | ||
To analyze bed elevation variability at a shoal adjacent to Cape Canaveral, Florida, an acoustic Doppler current profiler (ADCP) was deployed in spring 2014 at the outer swale of Shoal E, ~20 km south east of the cape tip at a depth of ~13 m. ADCP-derived velocity profiles and suspended particle concentrations were used to quantify instantaneous temporal changes in bed elevation (dζ/dt) using a simplified version of the Exner equation. Using mass conservation, temporal (deposition and entrainment) and spatial gradients in suspended sediment concentrations were calculated, although neither bed-load fluxes nor spatial gradients in velocities were considered. | |||
Calculated values for instantaneous dζ/dt ranged from erosion at ~1e-3 m/s to accretion at 0.5e-3 m/s. Most of the variability was found at subtidal (<1 cycle/day) and tidal (~2 cycles/day) periodicities. Bed changes were small (<0.005 m/s) when tidal motions were important, e.g. from May 6 to 16, whereas subtidal motions at periods of 1 and 8 days dominated erosion/accretion events between May 16 and 31. Values suggest a bed erosion of 3.1e-3 m during ~30 days of the experiment, which was 2 orders of magnitude less, and had a contrary tendency to the average accretion of ~150e-3 m in 37 days measured between July 28 and September 3 at the edge of Southeast Shoal, i.e. ~5 km to the northwest. | |||
In addition to the fact that measurements were not performed simultaneously at the same location, the discrepancy in dζ/dt could be attributed to the underestimation of bed changes due to the exclusion of bed-load fluxes. Despite several uncertainties, these findings provide preliminary evidence regarding the role of seasonal and storm-driven subtidal flows in particulate transport at cape-associated shoals. Our methodology can be used to inform numerical models of sediment transport and morphological evolution along inner continental shelves. | |||
|CSDMS meeting posterPDF=Paniagua-Arroyave_CSDMS-SEN_20170521.pdf | |||
|CSDMS meeting posterPNG=Paniagua-Arroyave_CSDMS-SEN_20170521.png | |||
}} | |||
{{CSDMS meeting abstract figures | |||
|CSDMS meeting abstract figure=Spring14 ShoalEOuterSwale dzdt sm.png | |||
|CSDMS meeting abstract figure caption=Upper left: time series of bed elevation changes, dζ/dt, derived from ADCP measurements of suspended particles concentrations; upper right: power spectrum of dζ/dt with 12 dofs at 95% of statistical confidence (interval given by the vertical line); bottom: continuous wavelet transform of dζ/dt using a Morlet wavelet (Gaussian-modulated wave with a normalized frequency of 6) with black lines surrounding confidence levels (95%). See text for details. | |||
}} | |||
{{CSDMS meeting abstract figures | |||
|CSDMS meeting abstract figure=Spring14 ShoalEOuterSwale Vel sm2.png | |||
|CSDMS meeting abstract figure caption=Upper panel: contours of time series of profiles of the east-west velocity component; middle panel: contours of the north-south velocity component; bottom panel: time series of vertically-averaged values for each velocity component. | |||
}} | }} | ||
{{blank line template}} | {{blank line template}} | ||
Latest revision as of 15:22, 1 June 2017
Browse abstracts
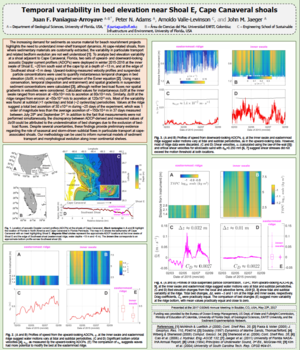
The increasing demand for sediments as source material for beach nourishment projects highlights the need to understand inner-shelf transport dynamics. At cape-related shoals, from where sedimentary materials are customarily extracted, the variability in particulate transport and related bedform evolution are not well understood.
To analyze bed elevation variability at a shoal adjacent to Cape Canaveral, Florida, an acoustic Doppler current profiler (ADCP) was deployed in spring 2014 at the outer swale of Shoal E, ~20 km south east of the cape tip at a depth of ~13 m. ADCP-derived velocity profiles and suspended particle concentrations were used to quantify instantaneous temporal changes in bed elevation (dζ/dt) using a simplified version of the Exner equation. Using mass conservation, temporal (deposition and entrainment) and spatial gradients in suspended sediment concentrations were calculated, although neither bed-load fluxes nor spatial gradients in velocities were considered.
Calculated values for instantaneous dζ/dt ranged from erosion at ~1e-3 m/s to accretion at 0.5e-3 m/s. Most of the variability was found at subtidal (<1 cycle/day) and tidal (~2 cycles/day) periodicities. Bed changes were small (<0.005 m/s) when tidal motions were important, e.g. from May 6 to 16, whereas subtidal motions at periods of 1 and 8 days dominated erosion/accretion events between May 16 and 31. Values suggest a bed erosion of 3.1e-3 m during ~30 days of the experiment, which was 2 orders of magnitude less, and had a contrary tendency to the average accretion of ~150e-3 m in 37 days measured between July 28 and September 3 at the edge of Southeast Shoal, i.e. ~5 km to the northwest.
In addition to the fact that measurements were not performed simultaneously at the same location, the discrepancy in dζ/dt could be attributed to the underestimation of bed changes due to the exclusion of bed-load fluxes. Despite several uncertainties, these findings provide preliminary evidence regarding the role of seasonal and storm-driven subtidal flows in particulate transport at cape-associated shoals. Our methodology can be used to inform numerical models of sediment transport and morphological evolution along inner continental shelves.
 |
| Upper left: time series of bed elevation changes, dζ/dt, derived from ADCP measurements of suspended particles concentrations; upper right: power spectrum of dζ/dt with 12 dofs at 95% of statistical confidence (interval given by the vertical line); bottom: continuous wavelet transform of dζ/dt using a Morlet wavelet (Gaussian-modulated wave with a normalized frequency of 6) with black lines surrounding confidence levels (95%). See text for details. |
 |
| Upper panel: contours of time series of profiles of the east-west velocity component; middle panel: contours of the north-south velocity component; bottom panel: time series of vertically-averaged values for each velocity component. |
