Form:Annualmeeting2018: Difference between revisions
No edit summary |
No edit summary |
||
| (192 intermediate revisions by 4 users not shown) | |||
| Line 1: | Line 1: | ||
#REDIRECT [[CSDMS_meeting_2018]] | |||
<noinclude>__NOEDITSECTION__ | <noinclude>__NOEDITSECTION__ | ||
{{ImageTopSet | {{ImageTopSet | ||
|direction=center | |direction=center | ||
|width=80% | |width=80% | ||
|title=<center>'' | |title=<center>''Geoprocesses, geohazards - CSDMS 2018''</center> | ||
|title-color=#ffffff | |title-color=#ffffff | ||
|title-link= | |title-link= | ||
| Line 9: | Line 10: | ||
|section-color=#ffffff | |section-color=#ffffff | ||
|section-link= | |section-link= | ||
|image=Limpopo3a.jpg | |||
|image= | |||
|quote= | |quote= | ||
|quote-color=#C0C0C0 | |quote-color=#C0C0C0 | ||
}} | }} | ||
<br> | |||
*Optional: May 21<sup>nd</sup> 2018, choose from 2 pre-conference events: | *<font color="red">Optional</font>: May 21<sup>nd</sup> 2018, choose from 2 pre-conference events: | ||
**[[Form: | **[[Form:Annualmeeting2018#Software_Carpentry_bootcamp|bootcamp]] | ||
**[[Form: | **[[Form:Annualmeeting2018#HPC_workshop|HPC workshop]] | ||
*Optional: May 25<sup>th</sup> 2018, [[Form: | *<font color="red">Optional</font>: May 25<sup>th</sup> 2018, [[Form:Annualmeeting2018#Post-conference_BMI_Hackathon|post-conference BMI hackathon]]<br><br> | ||
<div style="float:right;">{{TOC limit|3}}</div><br><br> | <div style="float:right;">{{TOC limit|3}}</div><br><br> | ||
= | =On site registration= | ||
Now closed. | |||
<!-- | <!--The online conference registration is a three step process: | ||
{| | {| | ||
|width=40% valign=bottom| | |width=40% valign=bottom| | ||
| Line 30: | Line 29: | ||
|width=60% valign=bottom| | |width=60% valign=bottom| | ||
{{#ifexist:User:{{CURRENTUSER}}|::{{#show:User:{{CURRENTUSER}} |? First name member}}, continue<br>with '''step 2'''| | {{#ifexist:User:{{CURRENTUSER}}|::{{#show:User:{{CURRENTUSER}} |? First name member}}, continue<br>with '''step 2'''| | ||
::<span class="plainlinks">[{{server}}{{localurl:Special:Userlogin|returnto=Form: | ::<span class="plainlinks">[{{server}}{{localurl:Special:Userlogin|returnto=Form:Annualmeeting2018}} Log in]</span> (<font size="0.6">or [[Special:RequestAccount | create account]] for non-CSDMS members</font>) <font color="gray" size="0.6"><br>Forgot username? <span class="plainlinks">[https://csdms.colorado.edu/wiki/Search_username Search]</span> or email:[mailto:CSDMSweb@colorado.edu CSDMSweb@colorado.edu]</font>}} | ||
|- | |- | ||
| <hr> | | <hr> | ||
| Line 38: | Line 37: | ||
<big>'''Step 2'''</big>: | <big>'''Step 2'''</big>: | ||
::* '''Register''' | ::* '''Register''' | ||
|valign=middle| | |valign=middle| | ||
::<div class="btn btn-lg btn-default lienbutton" type="button" style=" padding-top: 0.3cm;">{{#formlink:form= | ::<div class="btn btn-lg btn-default lienbutton" type="button" style=" padding-top: 0.3cm;">{{#formlink:form=Annualmeeting2018|link text=Start registration|link type=|new window}}<div> | ||
|- | |- | ||
|<hr> | |<hr> | ||
| Line 47: | Line 45: | ||
|valign=bottom| | |valign=bottom| | ||
<big>'''Step 3'''</big>: | <big>'''Step 3'''</big>: | ||
::* '''<font color="red">See notice [[Form: | ::* '''<font color="red">See notice [[Form:Annualmeeting2018#Reimbursement|reimbursement]]</font>''' | ||
::* '''Academia or Government: $ | ::* '''Academia or Government: $225''' ''(After April 1<sup>st</sup> $300)''<br> | ||
::* '''Industry: $ | ::* '''Industry: $450 ''' ''(After April 1<sup>st</sup> $525)''<br> | ||
::* '''Add $30 per joining pre or post conference events''' | ::* '''Add $30 per joining pre or post conference events''' | ||
|valign=middle|<br> | |valign=middle|<br> | ||
::<span class="plainlinks"><div class="btn btn-lg btn-default lienbutton" type="button" style=" padding-top: 0.3cm;">[https://www.regonline.com/ | ::<span class="plainlinks"><div class="btn btn-lg btn-default lienbutton" type="button" style=" padding-top: 0.3cm;">[https://www.regonline.com/CSDMS2018 Pay]</div></span><br><font color="gray" size="0.6">''Third party website''</font> | ||
|- | |- | ||
|<hr> | |<hr> | ||
| Line 60: | Line 58: | ||
<font color="gray">''You only are successfully registered by fulfilling the above steps''</font><br> | <font color="gray">''You only are successfully registered by fulfilling the above steps''</font><br> | ||
<font color="gray">Do you want to make changes to your registration? If so:</font> | <font color="gray">Do you want to make changes to your registration? If so:</font> | ||
:# <span class="plainlinks">[{{server}}{{localurl:Special:Userlogin|returnto=Form: | :# <span class="plainlinks">[{{server}}{{localurl:Special:Userlogin|returnto=Form:Annualmeeting2018}} Log in].</span><font color="gray"> | ||
:# Select your ''[[ | :# Select your ''[[CSDMS_meeting_2018_participant_list|registration record here]]'' and start by clicking on "Edit registration"</font>.--><br><br> | ||
=Introduction= | =Introduction= | ||
Natural hazards impact thousands of people every year; floods, droughts, extreme storms, landslides, wildfires, permafrost erosion all change the Earth's surface and inflict tremendous damage to human infrastructure. Most often, humans respond to disasters "after the fact" and a paradigm shift is needed to a strategy of resilience that would provide a way to reduce vulnerability to disasters and their impacts before they occur. Numerical models of earth surface processes are one tool to simulate natural hazards and provide quantitative pre-event risk assessment. Yet, such assessments are only appropriate if the models capture all important physical processes, when the models are tested and well-vetted, when they are useable and proven accurate. This workshop aims to identify what are critical missing components in our ability to provide better assessment of earth surface change in face of natural hazards. | Natural hazards impact thousands of people every year; floods, droughts, extreme storms, landslides, wildfires, permafrost erosion all change the Earth's surface and inflict tremendous damage to human infrastructure. Most often, humans respond to disasters "after the fact" and a paradigm shift is needed to a strategy of resilience that would provide a way to reduce vulnerability to disasters and their impacts before they occur. Numerical models of earth surface processes are one tool to simulate natural hazards and provide quantitative pre-event risk assessment. Yet, such assessments are only appropriate if the models capture all important physical processes, when the models are tested and well-vetted, when they are useable and proven accurate. This workshop aims to identify what are critical missing components in our ability to provide better assessment of earth surface change in face of natural hazards. | ||
The meeting will bring together experts in earth surface process modeling in a three-day hands-on workshop to identify shortcomings in our current natural hazard process understanding, both fundamentally in the earth surface processes as well as in the modeling approaches and technology. The workshop aims to improve natural hazard modeling for risk assessment, with a special focus on building a next-generation cyberinfrastructure and a community of modern modeling and data analysis practice, including high performance computing techniques. | The meeting will bring together experts in earth surface process modeling in a three-day hands-on workshop to identify shortcomings in our current natural hazard process understanding, both fundamentally in the earth surface processes as well as in the modeling approaches and technology. The workshop aims to improve natural hazard modeling for risk assessment, with a special focus on building a next-generation cyberinfrastructure and a community of modern modeling and data analysis practice, including high performance computing techniques. | ||
We are pleased to announce that this year's meeting is co-sponsored by the [http://www.sedexp.net Sediment Experimentalist Network (SEN)] and the [http://polar.crc.nd.edu Polar RCN]. | |||
<br><br> | |||
<!-- | |||
=Remote Participation= | |||
'''''Only for Remote Participation!''''': Registration for Remote Participation is required in advance (there is no fee for remote participants). Once you have registered, a link will be forwarded with detailed remote joining instructions. | |||
'''''<big>Please complete the remote participation registration process for each session you would like to attend:</big>'''''<br><br> | |||
''Tuesday, May 22<sup>nd</sup>''<br> | |||
Morning Session 8:45AM to 11:00AM (MDT): Registration URL: | |||
Afternoon Session 3:30PM to 4:15PM (MDT) Registration URL: | |||
''Wednesday, May 23<sup>rd</sup>''<br> | |||
Morning Session 8:45AM to 10:30AM (MDT) Registration URL: | |||
Wednesday Afternoon: no Plenary talks | |||
''Thursday, May 24<sup>th</sup>''<br> | |||
Morning Session 8:45AM to 10:15AM (MDT) Registration URL: | |||
Afternoon Session 1:15PM to 5:00PM (MDT) Registration URL: | |||
<br><br> | <br><br> | ||
--> | |||
=Objectives and general description= | =Objectives and general description= | ||
Numerical models of earth surface processes are one tool to simulate natural hazards and provide quantitative pre-event risk assessment. Such assessments are only appropriate if the models capture all important physical processes, when the models are tested and well-vetted, when they are useable and proven accurate. The CSDMS 2018 | Numerical models of earth surface processes are one tool to simulate natural hazards and provide quantitative pre-event risk assessment. Such assessments are only appropriate if the models capture all important physical processes, when the models are tested and well-vetted, when they are useable and proven accurate. The Geoprocesses, geohazards - CSDMS 2018 workshop aims to: | ||
# Identify new frontiers in fundamental process understanding in earth surface and natural hazards modeling. New algorithms, cyberinfrastructure development and new model couplings appear paramount to explore important process dynamics and linkages. | # Identify new frontiers in fundamental process understanding in earth surface and natural hazards modeling. New algorithms, cyberinfrastructure development and new model couplings appear paramount to explore important process dynamics and linkages. | ||
# Identify needs and develop strategies for model testing, model validation and model benchmarking against natural disasters as they happen, and rapidly afterwards. Massive high-resolution topographic data acquisition allows for more rigorous model to real-world data testing, but what are the obstacles and needs for improved use of disasters as opportunities for improving process models? | # Identify needs and develop strategies for model testing, model validation and model benchmarking against natural disasters as they happen, and rapidly afterwards. Massive high-resolution topographic data acquisition allows for more rigorous model to real-world data testing, but what are the obstacles and needs for improved use of disasters as opportunities for improving process models? | ||
| Line 90: | Line 107: | ||
==Agenda== | ==Agenda== | ||
Click [[Media:CSDMS2018FinalAgenda.pdf|here]] to view the draft agenda of 05/7/2018.<br><br> | |||
=Keynote Speakers= | ==Keynote Speakers== | ||
{{Keynote-clinics | {{Keynote-clinics | ||
| name = Irina Overeem | | name = Susan Cutter | ||
| affiliation = University of South Carolina | |||
| participants = | |||
| theme = disaster vulnerability and resilience science | |||
| title = Social Vulnerability and Community Resilience to Natural Hazards: Models, Tools, and Practice | |||
| abstract = This presentation provides an overview of two important concepts in natural hazards—social vulnerability and community resilience. Conceptually, vulnerability and resilience are related, but they are not the opposite extensions of one another. Instead they are driven by different questions: 1) what circumstances create the social burdens of risk and how do these affect the distribution of risks and losses (e.g. vulnerability); and 2) what enhances or reduces the ability of communities to prepare for, respond to, recover from, successfully adapt to, or anticipate hazard threats, and how does this vary geographically (resilience). In order to provide the scientific basis for hazard reduction policies and practices, measurement schemes for social vulnerability and community resilience are required. This presentation reviews an existing tool for measuring social vulnerability, the Social Vulnerability Index or SoVI®, which is widely used in the USA in both hazard mitigation planning and disaster recovery. Emerging metrics for monitoring community resilience are also described, beginning with the Baseline Resilience Indicators for Communities (or BRIC) Index. The spatial patterning and temporal variability in the indices as well as the importance of scale are described. Practical examples of how BRIC and SoVI have been used in the USA by emergency managers and hazards (spatial) planning are illustrated. | |||
}}<br> | |||
{{Keynote-clinics | |||
| name = Joannes Westerink | |||
| affiliation = U Notre Dame | |||
| participants = | |||
| theme = | |||
| title = Storm surge model ADCIRC for risk assessment | |||
| abstract = | |||
}}<br> | |||
{{Keynote-clinics | |||
| name = Jenny Suckale | |||
| affiliation = Stanford University | |||
| participants = | |||
| theme = modeling complex multi-phase fluid flows for hazard analysis (and especially volcanic processes) | |||
| title = Multiphase instabilities and extreme events in different natural systems | |||
| abstract = Natural disasters push the process of scientific discovery to its limits: Their enormous scale makes them difficult to recreate in the lab, their destructive power and rare occurrence limit the possibility of acquiring field data, and their profoundly nonlinear behavior over a wide range of scales poses significant modeling challenges. In this talk, I explore how we can leverage insights from four different natural systems to contribute to our fundamental scientific understanding of the role that multiphase processes play in the onset and evolution of extreme events and to our ability to mitigate associated risks. | |||
}}<br> | |||
{{Keynote-clinics | |||
| name = Paul Bates | |||
| affiliation = University of Bristol, UK | |||
| participants = | |||
| theme = | |||
| title = Modelling flood risk in the continental US | |||
| abstract = Flood modelling at global scales represents a revolution in hydraulic science and has the potential to transform decision-making and risk management in a wide variety of fields. Such modelling draws on a rich heritage of algorithm and data set development in hydraulic modelling over the last 20 years, and is now beginning to yield new insights into current and future flood risk. This paper reviews this progress and outlines recent efforts to develop a 30m resolution true hydrodynamic model of the entire conterminous US. The model is built using an automated framework which uses US National Elevation Dataset, the HydroSHEDS river network, regionalised frequency analysis to determine extreme flow and rainfall boundary conditions and the USACE National Levee Dataset to characterize flood defences. Comparison against FEMA and USGS flood maps shows the continental model to have skill approaching that of bespoke models built with local data. The paper describes the development and testing of the model, and it use to estimate current and future flood risk in the US using high resolution population maps and development projections. | |||
}}<br> | |||
{{Keynote-clinics | |||
| name = Phaedra Upton | |||
| affiliation = NZ Geoscience | |||
| participants = | |||
| theme = seismically triggered landsliding | |||
| title = Earthquake-induced landslides and landscape dynamics: The 2016 Kaikōura Earthquake and response | |||
| abstract = The Mw 7.8 Kaikōura earthquake was a complex one, rupturing ~20 faults on and offshore including several that had not been recognised as active. It also generated tens of thousands of landslides, hundreds of landslide dams and damaged hillslopes that are now susceptible to failure during rainstorms and aftershocks. The landslide debris, when mobilised, will create new hazards – further landsliding, rapid aggregation, increased river channel instability and will threaten infrastructure into the future. Several large landslides closed State Highway 1 along the Kaikōura coast for over a year forcing major changes to New Zealand’s main transport route from Wellington to Christchurch. The road has reopened but repair work continues and it remains vulnerable to further disruption and closures.<br>These hazards are likely to persist for years to decades, requiring active management but also providing researchers with a natural laboratory with which to quantify post-earthquake landscape dynamics. Researchers in New Zealand and their overseas colleagues started to collect perishable data immediately after the earthquake and are continuing to do so. Repeat LiDAR surveys, ground profiling, field monitoring, laboratory testing and numerical modelling will be integrated to determine how hillslopes and rivers will respond to future forcing events. The goal is to produce an integrated set of predictive tools to manage earthquake and post-earthquake landslide risk. | |||
}}<br> | |||
{{Keynote-clinics | |||
| name = Robert Weiss | |||
| affiliation = Virginia Tech | |||
| participants = | |||
| theme = tsunami hazard assessment | |||
| title = Simulating the tsunami hazard: quantitative predictions | |||
| abstract = Earthquakes are the most frequent source of classic tsunami waves. Other processes that generate tsunami waves include, landslides, volcanic eruption and meteorite impacts. Furthermore, atmospheric disturbances can also generate tsunami waves or at least tsunami-like waves, but we are just at the beginning of understanding their physics and frequency. Classic tsunami waves long waves with wavelength that are much longer than the water depth. For earthquake-generated tsunami waves that is true. However, landslides and meteorite impacts generate tsunami waves that are shorter which has a profound effect on the tsunami evolution, but no less dangerous.<br>Fortunately, tsunamis do not occur frequently enough in any given region to make meaningful prediction of the future tsunami hazard based only on recorded history. The geologic record has to be interrogated. The inversion of meaningful and quantitative data from the geologic record is the main goal of my research. However, there are problems with the geologic record. The most important problem is that we often have trouble to identify tsunami deposits. Second, it is very often difficult to separate the tsunami record from the storm record in regions where storms and tsunamis are competing agents of coastal change. Other problems are concerned with he completeness of the deposits, but also the fact that sedimentary environment before the tsunami hit most likely was eroded is no longer part of the record makes inversion especially tricky. In my research, I assume that the tsunami deposit is identified, but perhaps not complete and what we know about the pre-event conditions is limited.<br>My talk will cover how the geologic record is used to invert quantitative information about the causative process. We are going to look at grain sizes from sand to boulders and what we can learn from the transport of these very different grain sizes about tsunamis and their impacts along respective coastal areas. The models that are employed to invert flow characteristics from deposits are based on Monte-Carlo simulations to overcome the issue of not knowing the pre-tsunami conditions with great confidence. If time permits, we also see how sea-level change affects tsunami impact at the coast. | |||
}}<br> | |||
{{Keynote-clinics | |||
| name = Terry Idol | |||
| affiliation = Open Geospatial Consortium (OGC) | |||
| participants = | |||
| theme = geodetic data for understanding earth-surface processes and related hazards | |||
| title = Disasters: Increasing Interoperability for User-driven State-of-the-Art Data and Models | |||
| abstract = How can we increase the diversity, richness and value of Spatial Data Infrastructure (SDI) to the Disasters and Natural Hazards community stakeholders? We’ll look at some of the current (and past) Open Geospatial Consortium initiatives to examine exciting work to enable sharing of complex data and models within the community using open standards. | |||
}}<br> | |||
{{Keynote-clinics | |||
| name = Mike Willis | |||
| affiliation = University of Colorado, Boulder | |||
| participants = | |||
| theme = geodetic data for understanding earth-surface processes and related hazards | |||
| title = Private Eyes are Watching You | |||
| abstract = The National Science Foundation and the National Geospatial Intelligence Agency have a commercial imagery agreement that provides very high resolution DigitalGlobe Inc satellite imagery to the science community. We have leveraged this imagery, high performance computing and open source workflows and code to produce tens of thousands of digital surface models. We have successfully produced repeat topography timeseries for over one fifth of the entire planet. I will show examples of current projects to examine inundation risks at the 20 largest port cities around the globe, landslides and earth ruptures that occurred during the November 2016 Kaikoura earthquake in New Zealand and assessment of ice mass changes at all latitudes. | |||
}}<br> | |||
{{Keynote-clinics | |||
| name = David George | |||
| affiliation = USGS Cascades Volcano Observatory | |||
| participants = | |||
| theme = modeling debris-flow hazards with GEOCLAW | |||
| title = Modeling earth-surface flow hazards with D-Claw | |||
| abstract = D-Claw is an extension of the software package GeoClaw (www.clawpack.org) for simulating flows of granular-fluid mixtures with evolving volume fractions. It was developed primarily for landslides, debris flows and related phenomena by incorporating principles of solid, fluid and soil mechanics. However, because the two-phase model accommodates variable phase concentrations, it can also be used to model fluid problems in the absence of solid content (the model equations reduce to the shallow water equations as the solid phase vanishes). We therefore use D-Claw to seamlessly simulate multifaceted problems that involve the interaction of granular-fluid mixtures and bodies of water. This includes a large number of cascading natural hazards, such as debris-avalanches and lahars that enter rivers and lakes, landslide-generated tsunamis, landslide dams and outburst floods that entrain debris, and debris-laden tsunami inundation. I will describe the basis of D-Claw's model equations and highlight some recent applications, including the 2015 Tyndall Glacier landslide and tsunami, potential lahars on Mt. Rainier that displace dammed reservoirs, and a hypothetical landslide-generated lake outburst flood near Sisters, Oregon. | |||
}}<br> | |||
{{Keynote-clinics | |||
| name = Chris Jenkins | |||
| affiliation = University of Colorado, Boulder | |||
| participants = | |||
| theme = BOEM Project | |||
| title = Scale- and Process-Jumps in a Multimodel Project on Hurricane Impacts at the Seabed | |||
| abstract = The multi-institution project "Shelf-Slope Sediment Exchange in the Northern Gulf of Mexico..." used a chain of models to examine the effect of hurricanes on the seabed in the Gulf of Mexico and their effect on infrastructure. The components were ROMS (Rutgers U) for weather, wave climate and currents; CSTMS (VIMS) for sediment transport, WBMsed for river discharges and hurriSlip for sediment failures and gravity ignitions (U Colorado), LES/RANS-TURBINS (U California, Santa Barbara) for downslope turbidity currents. The project was an ambitious testing of the ability of these models to connect, and achieved most of the goals set out. The test case was 3 years of oceanographic data for Louisiana-Mississippi-Alabama including storms Dolly, Gustav, and Ike.<br>Connection between the models was a challenge on several levels. (i) Physical dimensionalities of the models were between 3D, 2.5D, 2D, and pointwise 0D. Model resolutions also varied. (ii) The models also reported daily, 3-hourly, or event- based responses. However different spatial and temporal scales in nature are observed to show different variances on aspects like sediment, and event return-time scalings. These are an added, often unforeseen difficulty for assembling multi-models,and validating them with data. (iii) Important process-jumps are involved in the total chain of sediment transport. Perhaps the most riveting are seabed mass-failures, and turbidity-current ignitions. Actually, separate modules often requiring energy considerations are required to handle such sharp phase-changes - sections of metastable deposits on the seafloor becoming slides, and of advecting suspended sediment layers becoming turbulent gravity flows. | |||
}}<br> | |||
{{Keynote-clinics | |||
| name = Joel Johnson | |||
| affiliation = University of Texas, Austin | |||
| participants = | |||
| theme = | |||
| title = Using tsunami sediment transport experiments to improve paleohydraulic inverse models | |||
| abstract = Joel Johnson, Katie Delbecq, Wonsuck Kim, David Mohrig<br>Department of Geological Sciences, The University of Texas at Austin<br><br>Tsunami deposits can imperfectly record the hydraulic conditions of devastating extreme events. Sand entrainment, advection and deposition in these events occurs under strongly disequilibrium conditions in which traditional sediment transport models behave poorly. Quantitative models relating sediment characteristics to flow hydraulics hold the potential to improve coastal hazard assessments. However, data from recent natural tsunamis have rarely been accurate enough, over a range of parameter space, to quantitatively test proposed inverse models for predicting flow characteristics. To better understand how to “read” flow depth and velocity from disequilibrium deposits, we conducted controlled and repeatable laboratory flume experiments in which different grain size distributions (GSDs) of sand were entrained, transported and deposited by hydraulic bores. The bores were created by impounding and instantaneously releasing ~6 m^3 of water with a computer-controlled lift gate. The experiments represent 1/10 to 1/100 scale physical models of large events. Both flow characteristics (including Froude numbers) and suspended sediment transport characteristics (including Rouse numbers and grain size trends) scale consistently with documented natural tsunamis.<br>We use the experimental data to interpret how entrainment, transport and mixing influence deposit GSDs along the flume. Suspension-dominated deposits get finer and thinner in the direction of transport. The data show that two key controls on GSDs along the flume are (a) the size distribution of the sediment source, and (b) turbulent dispersion of grains. First, the influence of source GSDs on deposit GSDs is strongest near the sediment source. Size-dependent suspension and settling become increasingly important farther down the flume. Transport distances of 1-2 advection length scales are required for deposit GSDs to be sensitive to flow hydraulics. Second, turbulent dispersion strongly influences local deposit GSDs. Importantly, intermediate deposit grain size percentiles (e.g. D50) are less sensitive to dispersive transport than either the fine or coarse tails of local deposit GSDs. Using deposit GSDs along the flume, an advection-settling model best predicts flow depths and velocities when calculated for intermediate percentiles (e.g. D50), rather than for coarse size fractions (e.g. D95) as has been assumed in previous works. We also highlight areas where our knowledge and predictive ability is limited and could be improved using experiments, including understanding the degree to which grain size sorting occurs during entrainment into suspension, and also during energetic bedload transport. Overall, the work suggests that physical models of tsunami sediment transport and deposition are invaluable for evaluating equation assumptions, benchmarking model results, and rigorously evaluating model uncertainties. | |||
}}<br> | |||
{{Keynote-clinics | |||
| name = Julio Hoffiman Mendes | |||
| affiliation = Stanford University | |||
| participants = | |||
| theme = | |||
| title = ImageQuilting.jl: A code for generating 3D stratigraphy from data collected in flume experiments | |||
| abstract = Surface processes are constantly reworking the landscape of our planet with perhaps the most diverse and beautiful patterns of sediment displacement known to humanity. Capturing this diversity is important for advancing our knowledge of systems, and for sustainable exploitation of natural resources by future generations. From a modeler's perspective, great diversity comes with great uncertainty. Although it is understandably very hard to quantify uncertainty about geological events that happened many years ago, we argue that modeling this uncertainty explicitly is crucial to improve our understanding of subsurface heterogeneity, as stratigraphy is direct function of surface processes. In this modeling work (and code), we aim to build realistic stratigraphic models that are constrained to local data (e.g. from wells, or geophysics) and that are, at the same time, subject to surface processes reflected in flume records. Experiments have improved tremendously in recent years, and the amount of data that they generate is posing new challenges to the surface processes community, who is asking more often the question "How do we make use of all this?" Traditional models based on differential equations and constitutive laws are not flexible enough to digest this information, nor were they created with this purpose. The community faces this limitation where the models cannot be conditioned on experiments, and even after exhaustive manual calibration of unobserved input parameters, these models often show poor predictive power. Our choice of inverse modeling and (geo)statistics (a.k.a. data science) was thus made knowing that these disciplines can provide the community with what we need: the ability to condition models of stratigraphy to measurements taken on a flume tank. | |||
}}<br> | |||
{{Keynote-clinics | |||
| name = Rachel Glade | |||
| affiliation = University of Colorado, Boulder | |||
| participants = | |||
| theme = | |||
| title = Modeling blocky hillslope evolution in layered landscapes | |||
| abstract = Landscapes developed in rock layers of differing erodibility are common on Earth, as well as on other planets. Hillslopes carved into the soft rock are typically characterized by steep, linear-to-concave up slopes or “ramps” mantled with material derived from the resistant layers above, often in the form of large blocks. To better understand the role of sediment size in hillslope evolution, we developed a 1-D numerical model of a hogback. The hybrid continuum-discrete model uses a traditional continuum treatment of soil transport while allowing for discrete, rules-based motion of large blocks of rocks. Our results show that feedbacks between weathering and transport of the blocks and underlying soft rock can create relief over time and lead to the development of concave-up slope profiles in the absence of rilling processes. In addition, the model reaches a quasi-steady state in which the topographic form and length of the ramp remains constant through time. We use an analytic approach to explore the mechanisms by which our model self-organizes to this state, including adjustment of soil depth, erosion rates, and block velocities along the ramp. An agreement of analytic solutions with the model shows that we understand its behavior well, and can carefully explore implications for hillslope evolution in the field. Current work explores the interactions between blocky hillslopes and channels in a 2-D numerical model built in Landlab. Our models provide a framework for exploring the evolution of layered landscapes and pinpoint the processes for which we require a more thorough understanding to predict their evolution over time. | |||
}}<br> | |||
{{Keynote-clinics | |||
| name = Jannis Hoch | |||
| affiliation = Utrecht University | |||
| participants = | |||
| theme = | |||
| title = GLOFRIM – A globally applicable framework for integrated hydrologic-hydrodynamic modeling | |||
| abstract = Economic losses and casualties due to riverine flooding increased in past decades and are most likely to further increase due to global change. To plan effective mitigation and adaptation measures and since floods often affect large areas showing spatial correlation, several global flood models (GFMs) were developed. Yet, they are either based on hydrologic or on hydrodynamic model codes. This may lower the accuracy of inundation estimates as large-scale hydrologic models often lack advanced routing schemes, reducing timeliness of simulated discharge, while hydrodynamic models depend on observed discharge or synthesized flood waves, hampering the representation of intra-domain processes.<br>To overcome this, GLOFRIM was developed. Currently, it allows for coupling one global hydrologic model, producing discharge and runoff estimates, with two hydrodynamics which perform the routing of surface water. By employing the Basic Model Interface (BMI) concept, both online and spatially explicit coupling of the models is supported. This way the coupled models remained unaffected, facilitating the separate development, storage, and updating of the models and their schematizations. Additionally, the framework is developed with easy accessibility and extensibility in mind, which allows other models to be added without extensive re-structuring. <br>In this presentation, the main underlying concepts of GLOFRIM as well as its workflow will be outlined, and first results showing the benefit of model coupling will be discussed. Besides, current limitations and need for future improvements will be pointed out. Last, current developments in code development, applications, and integrations with other research fields will be presented and discussed. | |||
}}<br><br> | |||
==Clinic Leaders== | |||
{{Keynote-clinics | |||
| name = Irina Overeem | |||
| affiliation = CU, CSDMS-IF | | affiliation = CU, CSDMS-IF | ||
| participants = People attending: {{#ask: [[ | | participants = People attending: {{#ask: [[Category: CSDMS meeting 2018 participants]][[CSDMS_meeting_select_clinics2_2018::4) Permafrost Toolbox]]|format=count}}<br> | ||
| title = | | title = Permafrost Toolbox | ||
| abstract = | | abstract = Instructors: Irina Overeem, Kang Wang, Elchin Jafarov<br><br>Permafrost is one of the Arctic climate indicators, and feedback of thawing permafrost to earth surface processes and vice versa is a research frontier. Observations can assess the current state of permafrost, but models are eventually essential to make predictions of future permafrost state and impacts on surface processes. In this 2hr clinic, we will present a new, easy-to-access and comprehensive cyberinfrastructure for permafrost modeling. The ‘Permafrost Modeling Toolbox’ includes three permafrost models of increasing complexity. The tools are embedded within the Community Surface Dynamics Modeling System Web Modeling Tool. We include multiple sets of sample inputs, representing a variety of climate and soil conditions and locations, to enable immediate use of the tools.<br>The hands-on clinic teaches students and researchers how to run and use several permafrost models with associated datasets. The presented models are envisioned to be the suitable for quick exploration of hypotheses and for teaching purposes. We will also explore options for model coupling, demonstrating an example of a model of coastal/delta sedimentation in permafrost environments. | ||
}}<br> | }}<br> | ||
{{Keynote-clinics | {{Keynote-clinics | ||
| name = | | name = Sediment Experimentalist Network (SEN) | ||
| affiliation = | | affiliation = | ||
| participants = People attending: {{#ask: [[ | | participants = People attending: {{#ask: [[Category: CSDMS meeting 2018 participants]][[CSDMS_meeting_select_clinics1_2018::4) Sediment Experimentalist Network]]|format=count}}<br>Max attendees: 25 <font color="red">Closed!</font> | ||
| title = | | title = Sediment Experimentalist Network (SEN) - Wrangling your research data | ||
| abstract = | | abstract = The earth-surface science community is producing increasing volumes of data in laboratory, numerical, and field studies. What new tools and resources can help us wrangle these data into meaningful scientific knowledge? Wherever you might be in the research lifecycle – planning experiments, preparing a manuscript, or recovering old data from hard drives – this year’s Sediment Experimentalist Network (SEN) clinic will inform you on leading practices for data planning, management, and publication.<br>In recent years, policies and tools have evolved with the potential to greatly increase our efficiency in dealing with scientific data. We’ll cover topics that will help throughout the data and experimental lifecycle, including the SEN Knowledge Base (sedexp.net), the growing collection of research data repositories, and AGU’s Enabling FAIR data project.<br>Enrollees will be contacted a couple weeks prior to the CSDMS meeting to engage in some brief pre-workshop activities to prepare for the clinic. We encourage participants to come prepared with information about their research projects, from which we can engage in practical discussions about data planning and management. | ||
}}<br> | }}<br> | ||
{{Keynote-clinics | {{Keynote-clinics | ||
| name = | | name = Guy Schumann<sup>1,2</sup> and Jeffrey Neal<sup>1</sup> | ||
| affiliation = | | affiliation = <sup>1</sup> University of Bristol, UK, <sup>2</sup> Remote Sensing Solutions Inc., Monrovia, CA, USA | ||
| participants = People attending: {{#ask: [[ | | participants = People attending: {{#ask: [[Category: CSDMS meeting 2018 participants]][[CSDMS_meeting_select_clinics1_2018::3) LISFlood]]|format=count}}<br>Max. attendees: 20 <font color="red">Closed!</font> | ||
| title = Introduction to | | title = LISFLOOD-FP Clinic: Introduction to Flood Hazard Modeling | ||
| abstract = This | | abstract = Flooding is one of the costliest natural disasters and recent events, including several hurricanes as well as flash floods, have been particularly devastating. In the US alone, the last few years have been record-breaking in terms of flood disasters and triggered many reactions in public opinions. Governments are now reviewing the available information to better mitigate the risks from flooding.<br>Typically, in the US, flood hazard mapping is done by federal agencies (USACE, FEMA and USGS), with traditionally, little room and need for research model development in flood hazard applications. Now, with the advent of the National Water Model, the status quo of flood hazard prediction in the US may be changing; however, inundation extent and floodplain depths in the National Water Model are still under early-stage development.<br>This Clinic provides a beginner introduction to the latest capabilities in large-scale 2-D modeling using the LISFLOOD-FP model developed by the University of Bristol with a nearly 20-year code history. This model has a very long history in research applications, while the algorithms behind the model made their way also into many existing industry model codes. The session will give participants insights into 2-D flood inundation modeling with LISFLOOD-FP and also a look at more sophisticated sub-grid channel implementations for large-scale application. More specifically, we will look at the data sets needed by the model and then run a simulation of the annual flooding on the Inner Niger Delta in Mali. The Clinic will also give participants the opportunity to look at some high-resolution LiDAR-based model results. | ||
}}<br> | }}<br> | ||
{{Keynote-clinics | {{Keynote-clinics | ||
| name = | | name = Steve Roberts & Mariela Perignon | ||
| affiliation = University | | affiliation = Australian National University & CU, CSDMS-IF | ||
| participants = People attending: {{#ask: [[ | | participants = People attending: {{#ask: [[Category: CSDMS meeting 2018 participants]][[CSDMS_meeting_select_clinics3_2018::3) ANUGA]]|format=count}} | ||
| title = | | title = Hydrodynamic modeling using the open source package ANUGA | ||
| abstract = | | abstract = ANUGA is an open source software package capable of simulating small-scale hydrological processes such as dam breaks, river flooding, storm surges and tsunamis. ANUGA is a Python-language model that solves the Shallow Water Wave Equation on an unstructured triangular grid and can simulate shock waves and rapidly changing flows. It was developed by the Australian National University and Geosciences Australia and has an active developer and user community.<br><br>The package supports discontinuous elevation, or ‘jumps’ in the bed profile between neighbouring cells. This has a number of benefits. Firstly it can preserve lake-at-rest type stationary states with wet-dry fronts. It can also simulate very shallow frictionally dominated flow down sloping topography, as typically occurs in direct-rainfall flood models. A further benefit of the discontinuous-elevation approach, when combined with an unstructured mesh, is that the model can sharply resolve rapid changes in the topography associated with e.g. narrow prismatic drainage channels, or buildings, without the computational expense of a very fine mesh. The boundaries between such features can be embedded in the mesh using break-lines, and the user can optionally specify that different elevation datasets are used to set the elevation within different parts of the mesh (e.g. often it is convenient to use a raster digital elevation model in terrestrial areas, and surveyed channel bed points in rivers). The discontinuous-elevation approach also supports a simple and computationally efficient treatment of river walls. These are arbitrarily narrow walls between cells, higher than the topography on either side, where the flow is controlled by a weir equation and optionally transitions back to the shallow water solution for sufficiently submerged flows. This allows modelling of levees or lateral weirs which are much finer than the mesh size.<br><br>This clinic will provide a hands-on introduction to hydrodynamic modeling using ANUGA. We will discuss the structure and capabilities of the model as we build and run increasingly complex simulations involving channels and river walls. No previous knowledge of Python is required. Example input files will be provided and participants will be able to explore the code and outputs at their own pace. | ||
}}<br> | }}<br> | ||
{{Keynote-clinics | {{Keynote-clinics | ||
| name = | | name = Mark Piper | ||
| affiliation = | | affiliation = CU, CSDMS-IF | ||
| participants = People attending: {{#ask: [[ | | participants = People attending: {{#ask: [[Category: CSDMS meeting 2018 participants]][[CSDMS_meeting_select_clinics1_2018::2) BMI Live!]]|format=count}} | ||
| title = | | title = BMI Live! | ||
| abstract = | | abstract = Mark Piper (mark.piper@colorado.edu) and Eric Hutton (eric.hutton@colorado.edu)<br>CSDMS Integration Facility, University of Colorado, Boulder, CO<br><br>In software engineering, an interface is a set of functions with prescribed names, argument types, and return types. When a developer implements an interface for a piece of software, they fill out the details for each function while keeping the signatures intact. CSDMS has developed the Basic Model Interface (BMI) for facilitating the conversion of an existing model written in C, C++, Fortran, Python or Java into a reusable, plug-and-play component. By design, BMI functions are straightforward to implement. However, when trying to match BMI functions to model behaviors, the devil is often in the details.<br>In this hands-on clinic, we'll take a simple model--an implementation of the two-dimensional heat equation in Python--and together, we'll write the BMI functions to wrap it, preparing it for transformation into a component. As we develop, we’ll explore how to use the wrapped model with a Jupyter Notebook.<br>To get the most out of this clinic, come prepared to code! We'll have a lot to write in the time allotted for the clinic. We recommend that clinic attendees have a laptop with the Anaconda Python distribution installed. We also request that you read over:<br>BMI description (https://csdms.colorado.edu/wiki/BMI_Description)<br>BMI documentation (http://bmi-python.readthedocs.io)<br>before participating in the clinic. | ||
}}<br> | }}<br> | ||
{{Keynote-clinics | {{Keynote-clinics | ||
| name = | | name = Nicole Gasparini | ||
| affiliation = | | affiliation = Tulane University | ||
| participants = People attending: {{#ask: [[ | | participants = People attending: {{#ask: [[Category: CSDMS meeting 2018 participants]][[CSDMS_meeting_select_clinics2_2018::2) Landlab]]|format=count}} | ||
| title = | | title = Landlab with Hydroshare | ||
| abstract = | | abstract = Landlab is a Python toolkit for building, coupling, and exploring two-dimensional numerical models of Earth-surface dynamics. Hydroshare is an online collaborative environment for sharing data and models. Hydroshare allows users to run models remotely, without needing to install software locally. This clinic will illustrate example Landlab models and how to run them on Hydroshare. This clinic will provide an introduction to Landlab’s features and capabilities, including how to create a model grid, populate it with data, and run numerical algorithms for surface hydrology, hillslope sediment transport, and stream incision. We will illustrate how models can be used for both research and teaching purposes. | ||
}}<br> | }}<br> | ||
{{Keynote-clinics | {{Keynote-clinics | ||
| name = | | name = Katy Barnhart | ||
| affiliation = | | affiliation = CU, CIRES | ||
| participants = People attending: {{#ask: [[ | | participants = People attending: {{#ask: [[Category: CSDMS meeting 2018 participants]][[CSDMS_meeting_select_clinics3_2018::2) Dakota]]|format=count}} | ||
| title = | | title = Model sensitivity analysis and optimization with Dakota and Landlab | ||
| abstract = | | abstract = Dakota is a flexible toolkit with algorithms for parameter optimization, uncertainty quantification, parameter estimation, and sensitivity analysis. In this clinic we will cover the basics of the Dakota framework, work through examples of using Dakota to compare field observations with model output using methods of sensitivity analysis and parameter optimization, and briefly cover the theoretical background of the Dakota methods used. If time permits, we will examine how the choice of comparison metrics influences results. Methods will be presented in the context of the Landlab Earth-surface dynamics framework but are generalizable to other models. Participants who are not familiar with Landlab are encouraged (but not required) to sign up for the Landlab clinic, which will take place before this clinic.<br>Participants do not need to install Landlab or Dakota prior to the clinic but will need to sign up for a Hydroshare account. https://www.hydroshare.org/sign-up/. <br>For those students interested in installing Landlab or Dakota: Installation instructions for Landlab can be found at: http://landlab.github.io (select "Install" from the menu bar at the top of the page). Installation instructions for Dakota can be found at https://dakota.sandia.gov/content/install-dakota. | ||
}}<br> | }}<br> | ||
{{Keynote-clinics | {{Keynote-clinics | ||
| name = | | name = Cam Wobus & Mark Lorie | ||
| affiliation = | | affiliation = ABT Associates | ||
| participants = People attending: {{#ask: [[ | | participants = People attending: {{#ask: [[Category: CSDMS meeting 2018 participants]][[CSDMS_meeting_select_clinics2_2018::3) Data for natural hazards]]|format=count}}<br>Max attendees: 30. <font color="red">Closed!</font> | ||
| title = | | title = Physical and Socio-Economic Data for Natural Hazards | ||
| abstract = | | abstract = In this workshop we will explore publicly available socioeconomic and hydrologic datasets that can be used to inform riverine flood risks under present-day and future climate conditions. We will begin with a summary of different stakeholders’ requirements for understanding flood risk data, through the lens of our experience working with federal, state and local clients and stakeholders. We will then guide participants through the relevant data sources that we use to inform these studies, including FEMA floodplain maps, census data, building inventories, damage functions, and future projections of extreme hydrologic events. We will gather and synthesize some of these data sources, discuss how each data source can be used in impact analyses; and discuss the limitations of each available data source. We will conclude with a brainstorming session to discuss how the scientific community can better produce actionable information for community planners, floodplain managers, and other stakeholders who might face increasing riverine flood risks in the future. | ||
}} | }}<br> | ||
{{Keynote-clinics | {{Keynote-clinics | ||
| name = | | name = Doug Edmonds & Samapriya Roy | ||
| affiliation = | | affiliation = Indiana University, Bloomington | ||
| participants = People attending: {{#ask: [[ | | participants = People attending: {{#ask: [[Category: CSDMS meeting 2018 participants]][[CSDMS_meeting_select_clinics1_2018::1) Google Earth Engine]]|format=count}}<br>Max attendees: 40. <font color="red">Closed!</font> | ||
| title = An Introduction to using Google Earth Engine | |||
| abstract = | | abstract = In this clinic we will explore how to use the new cloud-based remote sensing platform from Google. Our hands-on clinic will teach you the basics of loading and visualizing data in Earth Engine, sorting through data, and creating different types of composite images. These techniques are a good starting point for more detailed investigations that monitor changes on earth’s surface. Prerequisites:<br>1) Bring your own laptop.<br>2) Chrome installed on your system: It will work with Firefox but has issues.<br>3) An active Google account - Register for an account with Google Earth Engine (https://earthengine.google.com/signup/) | ||
}}<br> | }}<br> | ||
{{Keynote-clinics | {{Keynote-clinics | ||
| name = | | name = Ethan Gutmann | ||
| affiliation = | | affiliation = NCAR | ||
| participants = People attending: {{#ask: [[ | | participants = People attending: {{#ask: [[Category: CSDMS meeting 2018 participants]][[CSDMS_meeting_select_clinics3_2018::1) Downscaling climate models for regional applications]]|format=count}}<br>Max attendees: 30. <font color="red">Closed!</font> | ||
| title = | | title = Making Use of Climate Model Output: Downscaling for Regional Applications | ||
| abstract = | | abstract = Getting usable information out of climate and weather models can be a daunting task. The direct output from the models typically has unacceptable biases on local scales, and as a result a large number of methods have been developed to bias correct or downscale the climate model output. This clinic will describe the range of methods available as well as provide background on the pros and cons of different approaches. This will cover a variety of approaches from relatively simple methods that just rescale the original output, to more sophisticated statistical methods that account for broader weather patterns, to high-resolution atmospheric models. We will focus on methods for which output or code are readily available for end users, and discuss the input data required by different methods. We will follow this up with a practical session in which participants will be supplied a test dataset and code with which to perform their own downscaling. Participants interested in applying these methods to their own region of interest are encouraged to contact the instructor ahead of time to determine what inputs would be required. | ||
}}<br> | }}<br> | ||
{{Keynote-clinics | {{Keynote-clinics | ||
| name = | | name = Chris Jenkins & Jeff Obelcz | ||
| affiliation = | | affiliation = University of Colorado, Boulder & NRL, Stennis | ||
| participants = People attending: {{#ask: [[ | | participants = People attending: {{#ask: [[Category: CSDMS meeting 2018 participants]][[CSDMS_meeting_select_clinics3_2018::4) Artificial Intelligence & Machine Learning]]|format=count}} | ||
| title = | | title = Forum on Artificial Intelligence & Machine Learning: What lies ahead for Earth Surface Modeling ? | ||
| abstract = | | abstract = The CSDMS 2018 Annual Meeting will include a forum on the subject of Artificial Intelligence (AI) and Machine Learning (ML) as they may affect Earth Surface Dynamics Modeling in the future. The objective is to gauge the interest and existing expertise among the participants of the 2018 ‘Hazards’ meeting, with a view to perhaps forming a working group embedded in CSDMS.<br>AI and ML are already in use in our field, principally for landscape classification and data interpolation. But they are also already heavily established in predictive modelling for the weather, and for biological and socio-economic fields, for example. This forum attempts to look forward and see how these new developments may affect our science and application of that science. The relationship between AI&ML and process modeling is likely to be a special point of discussion.<br>The 2hour forum will include a series of lightning presentations, and printed plus online display materials. It will discuss whether to, and how to create a formal working group on the subject within the CSDMS community, and what the activities should be. | ||
}}<br> | }}<br> | ||
{{Keynote-clinics | {{Keynote-clinics | ||
| name = | | name = Chris Sherwood | ||
| affiliation = | | affiliation = USGS | ||
| participants = People attending: {{#ask: [[ | | participants = People attending: {{#ask: [[Category: CSDMS meeting 2018 participants]][[CSDMS_meeting_select_clinics2_2018::1) Structure from Motion (SfM)]]|format=count}} | ||
| title = | | title = How to make accurate digital elevation models using imagery from drones | ||
| abstract = | (or even walking around) | ||
}} | | abstract = Modern photogrammetry allows us to make very accurate three-dimensional models using images from consumer-grade cameras. Multiview stereo photogrammetry, also known as structure from motion (SfM) is now easily accessible. Coupled with drones, this is transformative technology that lets us all make better maps than the National Geodetic Survey could not long ago. This hands-on course will demonstrate the basic tools and provide some tips that will allow you to map your favorite field area with 3 - 5 cm horizontal resolution and vertical RMS errors of less than 10 cm. Even better resolution can be obtained for smaller areas, such as outcrops, archaeological digs, or your daughter's art project.<br>We will use Agisoft Photoscan Pro software...please download the free demo (Pro) version before the class. It works equally well on Mac, Windows, and Linux. If you have a choice, chose a machine with an NVidia graphics card. We encourage you to collect a set of images to bring to the class. Guidelines on how best to take images intended for SfM will be send around before the meeting. | ||
<br><br> | }}<br><br> | ||
=Participants= | =Participants= | ||
Who is registered | Who is registered as of {{#time: m/d/Y|now}}? | ||
*[[ | *[[CSDMS_meeting_2018_participant_list|Participants meeting]] | ||
*[[ | *[[CSDMS_meeting_2018_abstract_list|Submitted abstracts]] | ||
*[[CSDMS_pre- | *[[CSDMS_pre-meeting_bootcamp_2018|Participants bootcamp]] May 22<sup>th</sup> | ||
*[[CSDMS_pre- | *[[CSDMS_pre-meeting_HPC_workshop_2018|Participants HPC workshop]] May 22<sup>th</sup> | ||
*[[CSDMS_post- | *[[CSDMS_post-meeting_hackathon_2018|Participants hackathon]] May 26<sup>th</sup><br><br> | ||
=Reimbursement = | =Reimbursement = | ||
<div class=AutoScaleImage>[[File:Desert-drought-dehydrated-clay-soil-60013.jpeg|350px|right|link=]]</div> | <div class=AutoScaleImage>[[File:Desert-drought-dehydrated-clay-soil-60013.jpeg|350px|right|link=]]</div> | ||
Within its budget, CSDMS intends to support member applicants to attend the annual meeting. Towards this goal, we encourage members to fully or partially cover their expenses if capable. We additionally thank those in the industry and agency fields for understanding that 1) we cannot compensate federal agency participants since our own funding is from NSF, and 2) we request that our industrial/ corporate participants cover their own costs thereby allowing more academic participants to attend. | Within its budget, CSDMS intends to partially support member applicants to attend the annual meeting. Towards this goal, we encourage members to fully or partially cover their expenses if capable. We additionally thank those in the industry and agency fields for understanding that 1) we cannot compensate federal agency participants since our own funding is from NSF, and 2) we request that our industrial/ corporate participants cover their own costs thereby allowing more academic participants to attend. Because CSDMS is in a bridge year between CSDMS 2.0 and CSDMS 3.0, the funding structure for this meeting is different that previous spring meetings. Please note the resulting changes to reimbursement and meeting support as detailed below. | ||
CSDMS is able to provide the following meeting support: | |||
'''Important for foreign travelers:''' If you need a visa to travel to USA, select a business visa. | <!--<font color="red">NOTICE: The maximum number that can be supported is reached. Therefore lodging support cannot be offered anymore (March, 24th) . Feel free to register for the meeting but realize that you are responsible for supporting your own lodging.</font>--> | ||
Participants and Poster Presenters - lodging will be provided at the designated meeting hotel (for the evenings of May 21st, 22nd and 23rd, shared rooms at 100% of cost and single rooms at 50% of cost), breakfast and lunch each day of the meeting and one dinner, shuttle service between meeting hotel and meeting venue. This support is available for registrations received through April 1, 2018 or until 100 registrations have been received. After the April 1st deadline, lodging reservations and costs will be the responsibility of the participant. | |||
Scholarship recipients, Keynote presenters, Clinic leaders and Awardees - travel support, registration support and lodging as specified in your invitation letter, breakfast and lunch each day of the meeting and one dinner, shuttle service between meeting hotel and meeting venue. | |||
Specific reimbursement procedures will be emailed to qualified attendees along with your final confirmation in early May, 2018. | |||
'''Important for foreign travelers:''' If you need a visa to travel to USA, select a business visa. Please email [mailto:csdms@colorado.edu csdms@colorado.edu] as soon as possible if you need an invitation letter and indicate any specific wording required. We will need to copy the entry stamp in your passport sometime during the meeting as proof that you were here on business as required by US tax laws (especially when dealing with airfare reimbursements). We are only able to provide reimbursement for airfare within the U.S. and in airlines that are U.S. flag carriers.<br><br> | |||
=Travel, Lodging and Conference Center Information= | =Travel, Lodging and Conference Center Information= | ||
The meeting will be held at [https://seec.colorado.edu/ SEEC]<br> | The meeting will be held at [https://seec.colorado.edu/ SEEC]<br> | ||
Hotel: [http://www.millenniumhotels.com/usa/millenniumboulder/ Millennium Harvest House Hotel] | Hotel: [http://www.millenniumhotels.com/usa/millenniumboulder/ Millennium Harvest House Hotel] | ||
Transportation: | Transportation: | ||
You can book transportation between DIA and Boulder here: [http://greenrideco3.hudsonltd.net/res?USERIDENTRY=CSDMS&LOGON=GO Green Ride Boulder]. And information on how to find [[Media:Counter_location_Verbiage_from_Customs.pdf|Green Ride Boulder at DIA]].<br> | You can book transportation between DIA and Boulder here: [http://greenrideco3.hudsonltd.net/res?USERIDENTRY=CSDMS&LOGON=GO Green Ride Boulder]. And information on how to find [[Media:Counter_location_Verbiage_from_Customs.pdf|Green Ride Boulder at DIA]].<br> | ||
We will provide a bus between the | We will provide a bus between the designated Hotel and the meeting venue each day (the shuttle is not able to stop at other area hotels). We will also provide transportation from the designated Hotel to the banquet (again, the shuttle is not able to stop at other area hotels). Please note that the parking adjacent to the SEEC building now requires payment for non-permit holders. You will need to park in the limited designated areas and provide payment in the adjacent kiosks.<br><br> | ||
=Pre-conference events= | =Pre-conference events= | ||
'''The following will apply to both the Software Carpentry bootcamp and the HPC workshop pre-conference events:''' | '''The following will apply to both the Software Carpentry bootcamp and the HPC workshop pre-conference events:''' | ||
* Registration is open | * Registration is open until April 2<sup>nd</sup> (or until program fills) and is handled through the 2018 meeting site.<br> | ||
* Each is capped at 30 participants (first paid first serve), and it has a $30 registration fee. | * Each is capped at 30 participants (first paid first serve), and it has a $30 registration fee. | ||
* Participant will be responsible for cost / organization of their extra day of hotel accommodation and dinner. Costs will not be reimbursed. | * Participant will be responsible for cost / organization of their extra day of hotel accommodation and dinner. Costs will not be reimbursed. | ||
| Line 216: | Line 350: | ||
==Software Carpentry bootcamp== | ==Software Carpentry bootcamp== | ||
<div style="float:right;">[[File:Boots.gif|200px|link=]]</div>CSDMS will host a one-day pre-conference [http://software-carpentry.org/ Software Carpentry bootcamp] on Monday May 21<sup>nd</sup>, 2018, led by Mariela Perignon and Mark Piper. <br>The objective of the bootcamp is to teach basic programming skills that | <div style="float:right;">[[File:Boots.gif|200px|link=]]</div>CSDMS will host a one-day pre-conference [http://software-carpentry.org/ Software Carpentry bootcamp] on Monday May 21<sup>nd</sup>, 2018, led by Mariela Perignon and Mark Piper. <br>The objective of the bootcamp is to teach basic programming skills that are useful for scientific computing and model development. This is an intensive, hands-on workshop for novice programmers and those with minimal experience in the specific topics covered. Instructors will cover basic elements of: | ||
# the Unix bash shell, | # the Unix bash shell, | ||
# Python programming | # Python programming with Numpy, and | ||
# Github for version control. | # Github for version control. | ||
Our instructors are earth scientists and have familiarity with the CSDMS framework | Our instructors are earth scientists and have familiarity with the CSDMS framework. Lessons and examples will be targeted toward relevant problems in the geosciences. The bootcamp intentionally precedes the CSDMS meeting, so the skills participants develop should be useful in the clinics during the meeting.<br><br> | ||
==HPC workshop== | |||
CSDMS will host a one-day pre-conference HPC workshop on Monday May 21<sup>nd</sup>, 2018, led by Thomas Hauser and his HPC Research Computing team. <br>The objective of the workshop is to teach | CSDMS will host a one-day pre-conference HPC workshop '''Essentials for HPCC model code''' on Monday May 21<sup>nd</sup>, 2018, led by Thomas Hauser and his HPC Research Computing team. <br>The objective of the workshop is to teach all essential programming skills to optimal use a HPCC. This will be an hands-on workshop.<br><br> | ||
=Post-conference BMI Hackathon= | |||
=Post-conference | <div style="float:right;">[[File:bmi-lego-left-facing.png|200px|link=]]</div>CSDMS will host a one-day post-conference hackathon on Friday May 25<sup>th</sup>, 2018, organized by Eric Hutton and Mark Piper.<br><br>A hackathon is loosely defined as a social gathering with the goal of collaboratively creating usable software. Here, we’ll hack BMIs. A BMI-ed model can be converted into a CSDMS component, which allows it to be called from PyMT and included in WMT, thereby increasing its visibility and use. | ||
<div style="float:right;">[[File:bmi-lego-left-facing.png|200px|link=]]</div>CSDMS will host a one-day post-conference hackathon on Friday May 25<sup>th</sup>, 2018, organized by Eric Hutton and Mark Piper.<br><br>A hackathon is loosely defined as a social gathering with the goal of collaboratively creating usable software. Here, we’ll hack BMIs. | Each attendee is invited to bring a model of their choice<sup>1</sup> to wrap with a BMI. The model can be in any CSDMS-supported language (C, C++, Fortran, Java, Python). Attendees should be proficient in the language of their chosen model. The attendees will work together to add BMIs to models. CSDMS staff will guide participants and provide technical assistance. The ultimate goal of the hackathon is to get each participant's model wrapped with a BMI. This is a lofty goal. The more likely outcome is that each participant will have a good start on getting their model wrapped.<br><br> | ||
Each attendee is invited to bring a model of their choice<sup>1</sup> to wrap with a BMI. The model can be in any CSDMS-supported language (C, C++, Fortran, Java, Python). Attendees should be proficient in the language of their chosen model | |||
Before the hackathon, attendees are expected to have read: | Before the hackathon, attendees are expected to have read: | ||
* [[BMI_Description|BMI description]] | * [[BMI_Description|BMI description]] | ||
* BMI specification (http://bmi-spec.readthedocs.io) | |||
* BMI documentation (http://bmi-python.readthedocs.io) | * BMI documentation (http://bmi-python.readthedocs.io) | ||
and to have attended a BMI clinic in the current or in an earlier year. Attendees need a laptop with either a working compiler for the language of their choice or an account on beach. To make the most of the hackathon, attendees should attempt to prepare their model for a BMI by refactoring it into initialize (sets the initial state of the model), update (advances the model by one time step), and finalize (shuts down the model) subprograms.<br><br> | and to have attended a BMI clinic in the current or in an earlier year. Attendees need a laptop with either a working compiler for the language of their choice or an account on beach. To make the most of the hackathon, attendees should attempt to prepare their model for a BMI by refactoring it into initialize (sets the initial state of the model), update (advances the model by one time step), and finalize (shuts down the model) subprograms.<br><br> | ||
| Line 241: | Line 370: | ||
'''Note:''' | '''Note:''' | ||
* Registration is open | * Registration is open until April 2<sup>st</sup> (or until the program fills) and is handled through the 2018 meeting site.<br> | ||
* The hackathon is capped at 12 participants (first paid first | * The hackathon is capped at 12 participants (first paid first served), and it has a $30 registration fee. | ||
* | * Participants will be responsible for cost / organization of their extra day of hotel accommodation and dinner. Costs will not be reimbursed. | ||
* We will cover coffee, continental breakfast and lunch during the hackathon.<br><br> | * We will cover coffee, continental breakfast and lunch during the hackathon.<br><br> | ||
=Syvitski Student Modeler Award 2018= | |||
<div style="float:right;">[[File:Julio.jpg|150px|link=|Julio]]<br>''Julio Hoffimann Mendes''</div>We are pleased to announce that Julio Hoffimann Mendes of Stanford University has won the Syvitski Student Modeler Award of 2018, with his work on Stochastic simulation by image quilting of process-based geological models. Julio will present his work during the Geoprocesses, Geohazards – CSDMS 2018 meeting. | |||
<br><br> | |||
=Student Scholarships= | =Student Scholarships= | ||
| Line 256: | Line 389: | ||
* Registration costs (you will still need to pay the registration fee, but will be reimbursed after attending the meeting) | * Registration costs (you will still need to pay the registration fee, but will be reimbursed after attending the meeting) | ||
* Hotel accommodations for three nights, starting May 21<sup>nd</sup>. (as outlined in Travel/Lodging section above - 100% paid if you agree to a roommate) | * Hotel accommodations for three nights, starting May 21<sup>nd</sup>. (as outlined in Travel/Lodging section above - 100% paid if you agree to a roommate) | ||
* Travel (air fare ''ONLY'' within the United States and local transport) | * Travel (air fare ''ONLY'' within the United States and local shuttle transport) | ||
* Per diem to help reimburse the cost of meals from 22-24 May 2018 not offered in the conference schedule | * Per diem to help reimburse the cost of meals from 22-24 May 2018 not offered in the conference schedule | ||
''All applicants will receive confirmation of their submission. Please notify us at [mailto:csdms@colorado.edu csdms@colorado.edu] if you do not receive confirmation within 24 hours of submission.''<br><br> | ''All applicants will receive confirmation of their submission. Please notify us at [mailto:csdms@colorado.edu csdms@colorado.edu] if you do not receive confirmation within 24 hours of submission.''<br><br> | ||
=Important dates= | =Important dates= | ||
<font color="gray"> | |||
* '''January 14<sup>th</sup>''': Registration opens | * '''January 14<sup>th</sup>''': Registration opens | ||
* '''January 15<sup>th</sup>''': [[Student_Modeler_Award_2018|Deadline for student modeler competition submission]] | |||
* '''January 31<sup>st</sup>''': Student modeler competition results announced | |||
* '''February 19<sup>th</sup>''': Deadline for student scholarship applications '''CSDMS''' | * '''February 19<sup>th</sup>''': Deadline for student scholarship applications '''CSDMS''' | ||
* '''April 1<sup>st</sup>''': Deadline | * '''February 26<sup>th</sup>''': Scholarship awardees notified | ||
<!-- * '''April | * '''April 1<sup>st</sup>''': Deadline abstract submission, discounted early registration and meeting supported hotel reservations (unless our cap of 100 lodgers has already been met). After this deadline, reservations and accommodation costs will be responsibility of participant.</font> | ||
* '''May 14<sup>th</sup>''': Deadline regular registration. ''Notice additional costs do apply.'' | <!-- * '''April 1<sup>st</sup>''': Deadline for meeting supported hotel reservations. After this deadline, reservations and accommodation costs will be responsibility of participant. --><font color="gray"> | ||
* '''May 14<sup>th</sup>''': Deadline regular registration. ''Notice additional costs do apply.''</font> | |||
* '''May | * '''May 21<sup>nd</sup>''': <font color="red">Optional</font>: pre-conference bootcamp or HPC workshop | ||
* '''May 22-24<sup>th</sup>''': CSDMS annual meeting | * '''May 22-24<sup>th</sup>''': CSDMS annual meeting | ||
* '''May 25<sup>th</sup>''': <font color="red">Optional</font>: post-conference hackathon | |||
* '''May 25<sup>th</sup>''': CSDMS Executive and Steering committees meetings (''by invitation only'')<br><br> | * '''May 25<sup>th</sup>''': CSDMS Executive and Steering committees meetings (''by invitation only'')<br><br> | ||
| Line 277: | Line 412: | ||
<div class="col-sm-4" style="valign:bottom;"><center><br><div class=AutoScaleImage>[[image:CSDMS_high_res_weblogo.jpg|440px|link=]]</div><br></center></div> | <div class="col-sm-4" style="valign:bottom;"><center><br><div class=AutoScaleImage>[[image:CSDMS_high_res_weblogo.jpg|440px|link=]]</div><br></center></div> | ||
<div class="col-sm-4" style="valign:bottom;"><br></div> | <div class="col-sm-4" style="valign:bottom;"><br></div> | ||
<div class="col-sm-4" style="valign:bottom;"><center><div class=AutoScaleImage>[[image: | <div class="col-sm-4" style="valign:bottom;"><center><div class=AutoScaleImage>[[image:Sen-logo.png|132px|link=http://www.sedexp.net]]</div><br></center> </div> | ||
</div> | </div> | ||
</div> | </div> | ||
</noinclude><includeonly> | </noinclude><includeonly> | ||
{{{info|page name= | {{{info|page name=2018 CSDMS meeting-<unique number;start=001>}}} | ||
<div id="wikiPreview" style="display: none; padding-bottom: 25px; margin-bottom: 25px; border-bottom: 1px solid #AAAAAA;"></div> | <div id="wikiPreview" style="display: none; padding-bottom: 25px; margin-bottom: 25px; border-bottom: 1px solid #AAAAAA;"></div> | ||
<center><big | <center><big>'''Geoprocesses, geohazards - CSDMS 2018'''</big></center><br><br> | ||
{|style="width:900px;" | {|style="width:900px;" | ||
|All submitted registrations will be reviewed by a CSDMS program committee. <br> | |All submitted registrations will be reviewed by a CSDMS program committee. <br> | ||
|- | |- | ||
| | | | ||
|- | |- | ||
|Please direct all inquiries to Lynn McCready: [mailto:csdms@colorado.edu csdms@colorado.edu] with subject title: "CSDMS Meeting | |Please direct all inquiries to Lynn McCready: [mailto:csdms@colorado.edu csdms@colorado.edu] with subject title: "CSDMS Meeting 2018" | ||
|}<br><br> | |}<br><br> | ||
__NOTOC__ | __NOTOC__ | ||
{{CSDMS_meeting_personal_information}} | {{CSDMS_meeting_personal_information}} | ||
{{{for template|CSDMS meeting personal information template- | {{{for template|CSDMS meeting personal information template-2018}}} | ||
{| class="formtable" | {| class="formtable" | ||
| valign=top style="width:300px;"|First name: | | valign=top style="width:300px;"|First name: | ||
| valign=top | {{{field|CSDMS meeting first name|mandatory| | | valign=top | {{{field|CSDMS meeting first name|mandatory|cols=27|rows=1}}} | ||
|- | |- | ||
| valign=top style="width:300px;"|Last name: | | valign=top style="width:300px;"|Last name: | ||
| valign=top | {{{field|CSDMS meeting last name|mandatory| | | valign=top | {{{field|CSDMS meeting last name|mandatory|cols=27|rows=1}}} | ||
|- | |- | ||
| valign=top |Organization: | | valign=top |Organization: | ||
| Line 311: | Line 442: | ||
|- | |- | ||
| valign=top |Town / City: | | valign=top |Town / City: | ||
| valign=top | {{{field|CSDMS meeting city|mandatory| | | valign=top | {{{field|CSDMS meeting city|mandatory|cols=27|rows=1}}} | ||
|- | |- | ||
| valign=top | Country: | | valign=top | Country: | ||
| Line 330: | Line 461: | ||
| valign=top | {{{field|CSDMS meeting phone|cols=27|rows=1}}} | | valign=top | {{{field|CSDMS meeting phone|cols=27|rows=1}}} | ||
|- | |- | ||
| valign=top colspan="2"| <br><font color="gray">''Please change your [ | | valign=top colspan="2"| <br><font color="gray">''Please change your [https://csdms.colorado.edu/wiki/User:{{CURRENTUSER}} user profile] if you moved recently''.</font> | ||
|} | |} | ||
{{{end template}}} | {{{end template}}} | ||
| Line 344: | Line 475: | ||
|} | |} | ||
<div id="pre_conference_yes"> | <div id="pre_conference_yes"> | ||
'''Note''': ''Pre-Conference is an one day event, May | '''Note''': ''Pre-Conference is an one day event, May 21<sup>th</sup> and will '''cost an additional $30'''. No reimbursements will be provided nor for the extra night hotel or dinner.'' | ||
</div> | </div> | ||
<div id="post_conference_yes"> | <div id="post_conference_yes"> | ||
'''Note''': ''Post-Conference is an one day event, May | '''Note''': ''Post-Conference hackaton is an one day event, May 25<sup>th</sup> and will '''cost an additional $30'''. No reimbursements will be provided nor for the extra night hotel or dinner.'' | ||
</div> | </div> | ||
{{{end template}}} | {{{end template}}} | ||
{{CSDMS_meeting_clinics}} | {{CSDMS_meeting_clinics}} | ||
{{{for template|CSDMS meeting select clinics1}}} | {{{for template|CSDMS meeting select clinics1 2018}}} | ||
{| class="formtable" | {| class="formtable" | ||
| valign=top colspan="2"| <br><font color="gray">''Help us schedule the meeting! Select for each day the clinic you would like to attend:''<br>''(See [ | | valign=top colspan="2"| <br><font color="gray">''Help us schedule the meeting! Select for each day the clinic you would like to attend:''<br>''(See [https://csdms.colorado.edu/wiki/Form:Annualmeeting2018#Clinic_Leaders clinic leaders] for more information)''</font><br><br> | ||
|- | |- | ||
| valign=top style="width:300px;"|Select <b>one clinic</b> for the 1<sup>st</sup> day<br>(<i>Parallel sessions</i>): | | valign=top style="width:300px;"|Select <b>one clinic</b> for the 1<sup>st</sup> day<br>(<i>Parallel sessions</i>): | ||
| valign=top |{{{field| | | valign=top |{{{field|CSDMS_meeting_select_clinics1_2018|mandatory|input type=dropbox|default = 2) BMI Live!|show on select=1) Google Earth Engine=>GEE_no; 3) LISFlood=>LISF_no; 4) Sediment Experimentalist Network=>SEN_no}}} | ||
|} | |} | ||
<div id="GEE_no"> | |||
<font color="red">'''Note''': ''As of February 12<sup>th</sup>, the Google Earth Engine clinic is full.<br>If you selected this clinic before February 12<sup>th</sup>, you can attend, otherwise please select another clinic''</font> | |||
</div> | |||
<div id="LISF_no"> | |||
<font color="red">'''Note''': ''As of March 2<sup>th</sup>, the LISFlood clinic is full.<br>If you selected this clinic before March 2<sup>th</sup>, you can attend, otherwise please select another clinic''</font> | |||
</div> | |||
<div id="SEN_no"> | |||
<font color="red">'''Note''': ''As of April 4<sup>th</sup>, the SEN clinic is full.<br>If you selected this clinic before April 4<sup>th</sup>, you can attend, otherwise please select another clinic''</font> | |||
</div> | |||
{{{end template}}} | {{{end template}}} | ||
{{{for template|CSDMS meeting select clinics2}}} | {{{for template|CSDMS meeting select clinics2 2018}}} | ||
{| class="formtable" | {| class="formtable" | ||
| valign=top style="width:300px;"|Select <b>one clinic</b> for the 2<sup>nd</sup> day<br>(<i>Parallel sessions</i>): | | valign=top style="width:300px;"|Select <b>one clinic</b> for the 2<sup>nd</sup> day<br>(<i>Parallel sessions</i>): | ||
| valign=top |{{{field| | | valign=top |{{{field|CSDMS_meeting_select_clinics2_2018|mandatory|input type=dropbox|default=1) Structure from Motion (SfM)|show on select=3) Data for natural hazards=>NatHazDat_no}}} | ||
|} | |} | ||
<div id="NatHazDat_no"> | |||
<font color="red">'''Note''': ''As of March 15<sup>th</sup>, the ''Data for natural hazards'' clinic is full.<br>If you selected this clinic before March 15<sup>th</sup>, you can attend, otherwise please select another clinic''</font> | |||
</div> | |||
{{{end template}}} | {{{end template}}} | ||
{{{for template|CSDMS meeting select clinics3}}} | {{{for template|CSDMS meeting select clinics3 2018}}} | ||
{| class="formtable" | {| class="formtable" | ||
| valign=top style="width:300px;"|Select <b>one clinic</b> for the 3<sup>rd</sup> day<br>(<i>Parallel sessions</i>) | | valign=top style="width:300px;"|Select <b>one clinic</b> for the 3<sup>rd</sup> day<br>(<i>Parallel sessions</i>) | ||
| valign=top |{{{field| | | valign=top |{{{field|CSDMS_meeting_select_clinics3_2018|mandatory|input type=dropbox|default=2) Dakota|show on select=1) Downscaling climate models for regional applications=>Downscaling_no}}} | ||
|} | |} | ||
<div id="Downscaling_no"> | |||
<font color="red">'''Note''': ''As of March 5<sup>th</sup>, the ''Downscaling climate models for regional applications'' clinic is full.<br>If you selected this clinic before March 5<sup>th</sup>, you can attend, otherwise please select another clinic''</font> | |||
</div> | |||
{{{end template}}} | {{{end template}}} | ||
| Line 381: | Line 528: | ||
{{{end template}}} | {{{end template}}} | ||
<div id="scholarship_CSDMS"> | <div id="scholarship_CSDMS"> | ||
'''Note''': ''This is only an indication that you would like to apply for the CSDMS offered student scholarships. See the meeting site to actually apply for the [ | '''Note''': ''This is only an indication that you would like to apply for the CSDMS offered student scholarships. See the meeting site to actually apply for the [https://csdms.colorado.edu/wiki/Form:Annualmeeting#Student_Scholarships CSDMS student scholarships]. | ||
</div> | </div> | ||
{{CSDMS_meeting_abstract}} | {{CSDMS_meeting_abstract}} | ||
{{{for template|CSDMS meeting abstract yes no}}} | {{{for template|CSDMS meeting abstract yes no 2018}}} | ||
{| class="formtable" | {| class="formtable" | ||
| valign=top colspan="2"| <br><font color="red">(We will not accept abstracts after April | | valign=top colspan="2"| <br><font color="red">(We will not accept abstracts after April 1<sup>nd</sup>)</font><br><br> | ||
|- | |- | ||
| valign=top style="width:300px;"|I am submitting an abstract: | | valign=top style="width:300px;"|I am submitting an abstract: | ||
| valign=top style="width:50px"|{{{field|CSDMS meeting abstract submit|mandatory|input type=radiobutton|default=No|show on select=No=>submit_abstract_no;Yes=> | | valign=top style="width:50px"|{{{field|CSDMS meeting abstract submit|mandatory|input type=radiobutton|default=No|show on select=No=>submit_abstract_no;Yes=>submit_abstract_yes}}} | ||
|valign=top width="500" style="padding-left: 75px;"|<div id="submit_abstract_no">'''''You have till April 1<sup>st</sup> to change your mind and submit an abstract. No poster space will be reserved for you for now. '''''</div> | |valign=top width="500" style="padding-left: 75px;"|<div id="submit_abstract_no">'''''You have till April 1<sup>st</sup> to change your mind and submit an abstract. No poster space will be reserved for you for now. '''''</div> | ||
|} | |} | ||
| Line 396: | Line 543: | ||
<div id="submit_abstract_yes"> | <div id="submit_abstract_yes"> | ||
{{{for template|CSDMS meeting abstract title | {{{for template|CSDMS meeting abstract title temp2018}}} | ||
{| class="formtable" | {| class="formtable" | ||
| valign=top style="width:300px;"|Title: | | valign=top style="width:300px;"|Title: | ||
| Line 432: | Line 579: | ||
{{{end template}}} | {{{end template}}} | ||
{{{for template|CSDMS meeting abstract template}}} | {{{for template|CSDMS meeting abstract template 2018}}} | ||
{| class="formtable" | {| class="formtable" | ||
| valign=top style="width:300px;"|Abstract: | | valign=top style="width:300px;"|Abstract: | ||
| Line 438: | Line 585: | ||
| valign=top |{{{field|CSDMS meeting posterPDF|uploadable|hidden}}} | | valign=top |{{{field|CSDMS meeting posterPDF|uploadable|hidden}}} | ||
| valign=top |{{{field|CSDMS meeting posterPNG|uploadable|hidden}}} | | valign=top |{{{field|CSDMS meeting posterPNG|uploadable|hidden}}} | ||
|} | |} | ||
{{{end template}}} | {{{end template}}} | ||
Latest revision as of 09:13, 14 October 2019
Redirect to:
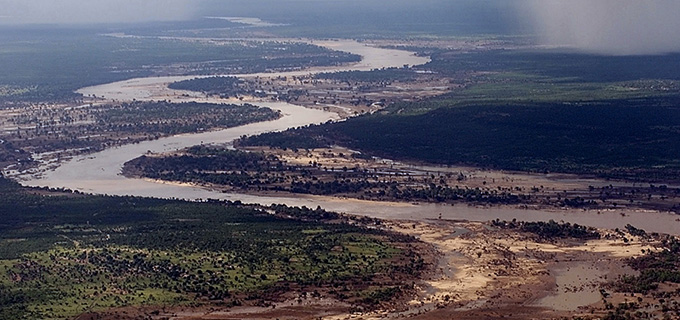
- Optional: May 21nd 2018, choose from 2 pre-conference events:
- Optional: May 25th 2018, post-conference BMI hackathon
On site registration
Now closed.
Introduction
Natural hazards impact thousands of people every year; floods, droughts, extreme storms, landslides, wildfires, permafrost erosion all change the Earth's surface and inflict tremendous damage to human infrastructure. Most often, humans respond to disasters "after the fact" and a paradigm shift is needed to a strategy of resilience that would provide a way to reduce vulnerability to disasters and their impacts before they occur. Numerical models of earth surface processes are one tool to simulate natural hazards and provide quantitative pre-event risk assessment. Yet, such assessments are only appropriate if the models capture all important physical processes, when the models are tested and well-vetted, when they are useable and proven accurate. This workshop aims to identify what are critical missing components in our ability to provide better assessment of earth surface change in face of natural hazards. The meeting will bring together experts in earth surface process modeling in a three-day hands-on workshop to identify shortcomings in our current natural hazard process understanding, both fundamentally in the earth surface processes as well as in the modeling approaches and technology. The workshop aims to improve natural hazard modeling for risk assessment, with a special focus on building a next-generation cyberinfrastructure and a community of modern modeling and data analysis practice, including high performance computing techniques.
We are pleased to announce that this year's meeting is co-sponsored by the Sediment Experimentalist Network (SEN) and the Polar RCN.
Objectives and general description
Numerical models of earth surface processes are one tool to simulate natural hazards and provide quantitative pre-event risk assessment. Such assessments are only appropriate if the models capture all important physical processes, when the models are tested and well-vetted, when they are useable and proven accurate. The Geoprocesses, geohazards - CSDMS 2018 workshop aims to:
- Identify new frontiers in fundamental process understanding in earth surface and natural hazards modeling. New algorithms, cyberinfrastructure development and new model couplings appear paramount to explore important process dynamics and linkages.
- Identify needs and develop strategies for model testing, model validation and model benchmarking against natural disasters as they happen, and rapidly afterwards. Massive high-resolution topographic data acquisition allows for more rigorous model to real-world data testing, but what are the obstacles and needs for improved use of disasters as opportunities for improving process models?
- Identify what are critical missing components in our ability to provide better assessment of earth surface change in face of natural hazards. How do we design scenario modeling, how do we communicate the uncertainty in model outcomes?
- Built researcher-to-researcher connections. Better connect earth surface process modelers with modelers of primary and secondary forcings, as well as social sciences and engineers to allow exploration of the human dimensions of natural disasters.
As in past meetings, keynote speakers are by invitation only, and poster presentations are the general media. The meeting will include:
- State-of-the art keynote presentations in earth-surface dynamics and modeling of natural hazards
- Hands-on clinics related to community models, tools and approaches
- Transformative software products and approaches designed to be accessible, easy to use, and relevant
- Breakout sessions discussing:
- Fundamentals of earth surface processes and hazard modeling; missing links and model coupling.
- Disasters are opportunities; challenges and needs for validation and benchmarking of process models against extreme events?
- Towards measures of risk: how to include human dimensions of natural disasters in numerical models?
- Hazard assessment: strategies and technological needs for modeling of scenarios of extreme events with future change to improve hazard prevention.
- Poster Sessions
- Consider signing up for the pre- and post-conference meetings as well. See below for more information on these.
Poster Information: The poster boards are configured for 4' wide by 6' tall (portrait orientation) posters.
Agenda
Click here to view the draft agenda of 05/7/2018.
Keynote Speakers
Susan Cutter
University of South CarolinaSocial Vulnerability and Community Resilience to Natural Hazards: Models, Tools, and Practice This presentation provides an overview of two important concepts in natural hazards—social vulnerability and community resilience. Conceptually, vulnerability and resilience are related, but they are not the opposite extensions of one another. Instead they are driven by different questions: 1) what circumstances create the social burdens of risk and how do these affect the distribution of risks and losses (e.g. vulnerability); and 2) what enhances or reduces the ability of communities to prepare for, respond to, recover from, successfully adapt to, or anticipate hazard threats, and how does this vary geographically (resilience). In order to provide the scientific basis for hazard reduction policies and practices, measurement schemes for social vulnerability and community resilience are required. This presentation reviews an existing tool for measuring social vulnerability, the Social Vulnerability Index or SoVI®, which is widely used in the USA in both hazard mitigation planning and disaster recovery. Emerging metrics for monitoring community resilience are also described, beginning with the Baseline Resilience Indicators for Communities (or BRIC) Index. The spatial patterning and temporal variability in the indices as well as the importance of scale are described. Practical examples of how BRIC and SoVI have been used in the USA by emergency managers and hazards (spatial) planning are illustrated. Joannes Westerink
U Notre DameStorm surge model ADCIRC for risk assessment Jenny Suckale
Stanford UniversityMultiphase instabilities and extreme events in different natural systems Natural disasters push the process of scientific discovery to its limits: Their enormous scale makes them difficult to recreate in the lab, their destructive power and rare occurrence limit the possibility of acquiring field data, and their profoundly nonlinear behavior over a wide range of scales poses significant modeling challenges. In this talk, I explore how we can leverage insights from four different natural systems to contribute to our fundamental scientific understanding of the role that multiphase processes play in the onset and evolution of extreme events and to our ability to mitigate associated risks. Paul Bates
University of Bristol, UKModelling flood risk in the continental US Flood modelling at global scales represents a revolution in hydraulic science and has the potential to transform decision-making and risk management in a wide variety of fields. Such modelling draws on a rich heritage of algorithm and data set development in hydraulic modelling over the last 20 years, and is now beginning to yield new insights into current and future flood risk. This paper reviews this progress and outlines recent efforts to develop a 30m resolution true hydrodynamic model of the entire conterminous US. The model is built using an automated framework which uses US National Elevation Dataset, the HydroSHEDS river network, regionalised frequency analysis to determine extreme flow and rainfall boundary conditions and the USACE National Levee Dataset to characterize flood defences. Comparison against FEMA and USGS flood maps shows the continental model to have skill approaching that of bespoke models built with local data. The paper describes the development and testing of the model, and it use to estimate current and future flood risk in the US using high resolution population maps and development projections. Phaedra Upton
NZ GeoscienceEarthquake-induced landslides and landscape dynamics: The 2016 Kaikōura Earthquake and response The Mw 7.8 Kaikōura earthquake was a complex one, rupturing ~20 faults on and offshore including several that had not been recognised as active. It also generated tens of thousands of landslides, hundreds of landslide dams and damaged hillslopes that are now susceptible to failure during rainstorms and aftershocks. The landslide debris, when mobilised, will create new hazards – further landsliding, rapid aggregation, increased river channel instability and will threaten infrastructure into the future. Several large landslides closed State Highway 1 along the Kaikōura coast for over a year forcing major changes to New Zealand’s main transport route from Wellington to Christchurch. The road has reopened but repair work continues and it remains vulnerable to further disruption and closures.
These hazards are likely to persist for years to decades, requiring active management but also providing researchers with a natural laboratory with which to quantify post-earthquake landscape dynamics. Researchers in New Zealand and their overseas colleagues started to collect perishable data immediately after the earthquake and are continuing to do so. Repeat LiDAR surveys, ground profiling, field monitoring, laboratory testing and numerical modelling will be integrated to determine how hillslopes and rivers will respond to future forcing events. The goal is to produce an integrated set of predictive tools to manage earthquake and post-earthquake landslide risk.Robert Weiss
Virginia TechSimulating the tsunami hazard: quantitative predictions Earthquakes are the most frequent source of classic tsunami waves. Other processes that generate tsunami waves include, landslides, volcanic eruption and meteorite impacts. Furthermore, atmospheric disturbances can also generate tsunami waves or at least tsunami-like waves, but we are just at the beginning of understanding their physics and frequency. Classic tsunami waves long waves with wavelength that are much longer than the water depth. For earthquake-generated tsunami waves that is true. However, landslides and meteorite impacts generate tsunami waves that are shorter which has a profound effect on the tsunami evolution, but no less dangerous.
Fortunately, tsunamis do not occur frequently enough in any given region to make meaningful prediction of the future tsunami hazard based only on recorded history. The geologic record has to be interrogated. The inversion of meaningful and quantitative data from the geologic record is the main goal of my research. However, there are problems with the geologic record. The most important problem is that we often have trouble to identify tsunami deposits. Second, it is very often difficult to separate the tsunami record from the storm record in regions where storms and tsunamis are competing agents of coastal change. Other problems are concerned with he completeness of the deposits, but also the fact that sedimentary environment before the tsunami hit most likely was eroded is no longer part of the record makes inversion especially tricky. In my research, I assume that the tsunami deposit is identified, but perhaps not complete and what we know about the pre-event conditions is limited.
My talk will cover how the geologic record is used to invert quantitative information about the causative process. We are going to look at grain sizes from sand to boulders and what we can learn from the transport of these very different grain sizes about tsunamis and their impacts along respective coastal areas. The models that are employed to invert flow characteristics from deposits are based on Monte-Carlo simulations to overcome the issue of not knowing the pre-tsunami conditions with great confidence. If time permits, we also see how sea-level change affects tsunami impact at the coast.Terry Idol
Open Geospatial Consortium (OGC)Disasters: Increasing Interoperability for User-driven State-of-the-Art Data and Models How can we increase the diversity, richness and value of Spatial Data Infrastructure (SDI) to the Disasters and Natural Hazards community stakeholders? We’ll look at some of the current (and past) Open Geospatial Consortium initiatives to examine exciting work to enable sharing of complex data and models within the community using open standards. Mike Willis
University of Colorado, BoulderPrivate Eyes are Watching You The National Science Foundation and the National Geospatial Intelligence Agency have a commercial imagery agreement that provides very high resolution DigitalGlobe Inc satellite imagery to the science community. We have leveraged this imagery, high performance computing and open source workflows and code to produce tens of thousands of digital surface models. We have successfully produced repeat topography timeseries for over one fifth of the entire planet. I will show examples of current projects to examine inundation risks at the 20 largest port cities around the globe, landslides and earth ruptures that occurred during the November 2016 Kaikoura earthquake in New Zealand and assessment of ice mass changes at all latitudes. David George
USGS Cascades Volcano ObservatoryModeling earth-surface flow hazards with D-Claw D-Claw is an extension of the software package GeoClaw (www.clawpack.org) for simulating flows of granular-fluid mixtures with evolving volume fractions. It was developed primarily for landslides, debris flows and related phenomena by incorporating principles of solid, fluid and soil mechanics. However, because the two-phase model accommodates variable phase concentrations, it can also be used to model fluid problems in the absence of solid content (the model equations reduce to the shallow water equations as the solid phase vanishes). We therefore use D-Claw to seamlessly simulate multifaceted problems that involve the interaction of granular-fluid mixtures and bodies of water. This includes a large number of cascading natural hazards, such as debris-avalanches and lahars that enter rivers and lakes, landslide-generated tsunamis, landslide dams and outburst floods that entrain debris, and debris-laden tsunami inundation. I will describe the basis of D-Claw's model equations and highlight some recent applications, including the 2015 Tyndall Glacier landslide and tsunami, potential lahars on Mt. Rainier that displace dammed reservoirs, and a hypothetical landslide-generated lake outburst flood near Sisters, Oregon. Chris Jenkins
University of Colorado, BoulderScale- and Process-Jumps in a Multimodel Project on Hurricane Impacts at the Seabed The multi-institution project "Shelf-Slope Sediment Exchange in the Northern Gulf of Mexico..." used a chain of models to examine the effect of hurricanes on the seabed in the Gulf of Mexico and their effect on infrastructure. The components were ROMS (Rutgers U) for weather, wave climate and currents; CSTMS (VIMS) for sediment transport, WBMsed for river discharges and hurriSlip for sediment failures and gravity ignitions (U Colorado), LES/RANS-TURBINS (U California, Santa Barbara) for downslope turbidity currents. The project was an ambitious testing of the ability of these models to connect, and achieved most of the goals set out. The test case was 3 years of oceanographic data for Louisiana-Mississippi-Alabama including storms Dolly, Gustav, and Ike.
Connection between the models was a challenge on several levels. (i) Physical dimensionalities of the models were between 3D, 2.5D, 2D, and pointwise 0D. Model resolutions also varied. (ii) The models also reported daily, 3-hourly, or event- based responses. However different spatial and temporal scales in nature are observed to show different variances on aspects like sediment, and event return-time scalings. These are an added, often unforeseen difficulty for assembling multi-models,and validating them with data. (iii) Important process-jumps are involved in the total chain of sediment transport. Perhaps the most riveting are seabed mass-failures, and turbidity-current ignitions. Actually, separate modules often requiring energy considerations are required to handle such sharp phase-changes - sections of metastable deposits on the seafloor becoming slides, and of advecting suspended sediment layers becoming turbulent gravity flows.Joel Johnson
University of Texas, AustinUsing tsunami sediment transport experiments to improve paleohydraulic inverse models Joel Johnson, Katie Delbecq, Wonsuck Kim, David Mohrig
Department of Geological Sciences, The University of Texas at Austin
Tsunami deposits can imperfectly record the hydraulic conditions of devastating extreme events. Sand entrainment, advection and deposition in these events occurs under strongly disequilibrium conditions in which traditional sediment transport models behave poorly. Quantitative models relating sediment characteristics to flow hydraulics hold the potential to improve coastal hazard assessments. However, data from recent natural tsunamis have rarely been accurate enough, over a range of parameter space, to quantitatively test proposed inverse models for predicting flow characteristics. To better understand how to “read” flow depth and velocity from disequilibrium deposits, we conducted controlled and repeatable laboratory flume experiments in which different grain size distributions (GSDs) of sand were entrained, transported and deposited by hydraulic bores. The bores were created by impounding and instantaneously releasing ~6 m^3 of water with a computer-controlled lift gate. The experiments represent 1/10 to 1/100 scale physical models of large events. Both flow characteristics (including Froude numbers) and suspended sediment transport characteristics (including Rouse numbers and grain size trends) scale consistently with documented natural tsunamis.
We use the experimental data to interpret how entrainment, transport and mixing influence deposit GSDs along the flume. Suspension-dominated deposits get finer and thinner in the direction of transport. The data show that two key controls on GSDs along the flume are (a) the size distribution of the sediment source, and (b) turbulent dispersion of grains. First, the influence of source GSDs on deposit GSDs is strongest near the sediment source. Size-dependent suspension and settling become increasingly important farther down the flume. Transport distances of 1-2 advection length scales are required for deposit GSDs to be sensitive to flow hydraulics. Second, turbulent dispersion strongly influences local deposit GSDs. Importantly, intermediate deposit grain size percentiles (e.g. D50) are less sensitive to dispersive transport than either the fine or coarse tails of local deposit GSDs. Using deposit GSDs along the flume, an advection-settling model best predicts flow depths and velocities when calculated for intermediate percentiles (e.g. D50), rather than for coarse size fractions (e.g. D95) as has been assumed in previous works. We also highlight areas where our knowledge and predictive ability is limited and could be improved using experiments, including understanding the degree to which grain size sorting occurs during entrainment into suspension, and also during energetic bedload transport. Overall, the work suggests that physical models of tsunami sediment transport and deposition are invaluable for evaluating equation assumptions, benchmarking model results, and rigorously evaluating model uncertainties.Julio Hoffiman Mendes
Stanford UniversityImageQuilting.jl: A code for generating 3D stratigraphy from data collected in flume experiments Surface processes are constantly reworking the landscape of our planet with perhaps the most diverse and beautiful patterns of sediment displacement known to humanity. Capturing this diversity is important for advancing our knowledge of systems, and for sustainable exploitation of natural resources by future generations. From a modeler's perspective, great diversity comes with great uncertainty. Although it is understandably very hard to quantify uncertainty about geological events that happened many years ago, we argue that modeling this uncertainty explicitly is crucial to improve our understanding of subsurface heterogeneity, as stratigraphy is direct function of surface processes. In this modeling work (and code), we aim to build realistic stratigraphic models that are constrained to local data (e.g. from wells, or geophysics) and that are, at the same time, subject to surface processes reflected in flume records. Experiments have improved tremendously in recent years, and the amount of data that they generate is posing new challenges to the surface processes community, who is asking more often the question "How do we make use of all this?" Traditional models based on differential equations and constitutive laws are not flexible enough to digest this information, nor were they created with this purpose. The community faces this limitation where the models cannot be conditioned on experiments, and even after exhaustive manual calibration of unobserved input parameters, these models often show poor predictive power. Our choice of inverse modeling and (geo)statistics (a.k.a. data science) was thus made knowing that these disciplines can provide the community with what we need: the ability to condition models of stratigraphy to measurements taken on a flume tank. Rachel Glade
University of Colorado, BoulderModeling blocky hillslope evolution in layered landscapes Landscapes developed in rock layers of differing erodibility are common on Earth, as well as on other planets. Hillslopes carved into the soft rock are typically characterized by steep, linear-to-concave up slopes or “ramps” mantled with material derived from the resistant layers above, often in the form of large blocks. To better understand the role of sediment size in hillslope evolution, we developed a 1-D numerical model of a hogback. The hybrid continuum-discrete model uses a traditional continuum treatment of soil transport while allowing for discrete, rules-based motion of large blocks of rocks. Our results show that feedbacks between weathering and transport of the blocks and underlying soft rock can create relief over time and lead to the development of concave-up slope profiles in the absence of rilling processes. In addition, the model reaches a quasi-steady state in which the topographic form and length of the ramp remains constant through time. We use an analytic approach to explore the mechanisms by which our model self-organizes to this state, including adjustment of soil depth, erosion rates, and block velocities along the ramp. An agreement of analytic solutions with the model shows that we understand its behavior well, and can carefully explore implications for hillslope evolution in the field. Current work explores the interactions between blocky hillslopes and channels in a 2-D numerical model built in Landlab. Our models provide a framework for exploring the evolution of layered landscapes and pinpoint the processes for which we require a more thorough understanding to predict their evolution over time. Jannis Hoch
Utrecht UniversityGLOFRIM – A globally applicable framework for integrated hydrologic-hydrodynamic modeling Economic losses and casualties due to riverine flooding increased in past decades and are most likely to further increase due to global change. To plan effective mitigation and adaptation measures and since floods often affect large areas showing spatial correlation, several global flood models (GFMs) were developed. Yet, they are either based on hydrologic or on hydrodynamic model codes. This may lower the accuracy of inundation estimates as large-scale hydrologic models often lack advanced routing schemes, reducing timeliness of simulated discharge, while hydrodynamic models depend on observed discharge or synthesized flood waves, hampering the representation of intra-domain processes.
To overcome this, GLOFRIM was developed. Currently, it allows for coupling one global hydrologic model, producing discharge and runoff estimates, with two hydrodynamics which perform the routing of surface water. By employing the Basic Model Interface (BMI) concept, both online and spatially explicit coupling of the models is supported. This way the coupled models remained unaffected, facilitating the separate development, storage, and updating of the models and their schematizations. Additionally, the framework is developed with easy accessibility and extensibility in mind, which allows other models to be added without extensive re-structuring.
In this presentation, the main underlying concepts of GLOFRIM as well as its workflow will be outlined, and first results showing the benefit of model coupling will be discussed. Besides, current limitations and need for future improvements will be pointed out. Last, current developments in code development, applications, and integrations with other research fields will be presented and discussed.
Clinic Leaders
Irina Overeem
CU, CSDMS-IF
People attending: 9Permafrost Toolbox Instructors: Irina Overeem, Kang Wang, Elchin Jafarov
Permafrost is one of the Arctic climate indicators, and feedback of thawing permafrost to earth surface processes and vice versa is a research frontier. Observations can assess the current state of permafrost, but models are eventually essential to make predictions of future permafrost state and impacts on surface processes. In this 2hr clinic, we will present a new, easy-to-access and comprehensive cyberinfrastructure for permafrost modeling. The ‘Permafrost Modeling Toolbox’ includes three permafrost models of increasing complexity. The tools are embedded within the Community Surface Dynamics Modeling System Web Modeling Tool. We include multiple sets of sample inputs, representing a variety of climate and soil conditions and locations, to enable immediate use of the tools.
The hands-on clinic teaches students and researchers how to run and use several permafrost models with associated datasets. The presented models are envisioned to be the suitable for quick exploration of hypotheses and for teaching purposes. We will also explore options for model coupling, demonstrating an example of a model of coastal/delta sedimentation in permafrost environments.Sediment Experimentalist Network (SEN)
People attending: 30
Max attendees: 25 Closed!Sediment Experimentalist Network (SEN) - Wrangling your research data The earth-surface science community is producing increasing volumes of data in laboratory, numerical, and field studies. What new tools and resources can help us wrangle these data into meaningful scientific knowledge? Wherever you might be in the research lifecycle – planning experiments, preparing a manuscript, or recovering old data from hard drives – this year’s Sediment Experimentalist Network (SEN) clinic will inform you on leading practices for data planning, management, and publication.
In recent years, policies and tools have evolved with the potential to greatly increase our efficiency in dealing with scientific data. We’ll cover topics that will help throughout the data and experimental lifecycle, including the SEN Knowledge Base (sedexp.net), the growing collection of research data repositories, and AGU’s Enabling FAIR data project.
Enrollees will be contacted a couple weeks prior to the CSDMS meeting to engage in some brief pre-workshop activities to prepare for the clinic. We encourage participants to come prepared with information about their research projects, from which we can engage in practical discussions about data planning and management.Guy Schumann1,2 and Jeffrey Neal1
1 University of Bristol, UK, 2 Remote Sensing Solutions Inc., Monrovia, CA, USA
People attending: 14
Max. attendees: 20 Closed!LISFLOOD-FP Clinic: Introduction to Flood Hazard Modeling Flooding is one of the costliest natural disasters and recent events, including several hurricanes as well as flash floods, have been particularly devastating. In the US alone, the last few years have been record-breaking in terms of flood disasters and triggered many reactions in public opinions. Governments are now reviewing the available information to better mitigate the risks from flooding.
Typically, in the US, flood hazard mapping is done by federal agencies (USACE, FEMA and USGS), with traditionally, little room and need for research model development in flood hazard applications. Now, with the advent of the National Water Model, the status quo of flood hazard prediction in the US may be changing; however, inundation extent and floodplain depths in the National Water Model are still under early-stage development.
This Clinic provides a beginner introduction to the latest capabilities in large-scale 2-D modeling using the LISFLOOD-FP model developed by the University of Bristol with a nearly 20-year code history. This model has a very long history in research applications, while the algorithms behind the model made their way also into many existing industry model codes. The session will give participants insights into 2-D flood inundation modeling with LISFLOOD-FP and also a look at more sophisticated sub-grid channel implementations for large-scale application. More specifically, we will look at the data sets needed by the model and then run a simulation of the annual flooding on the Inner Niger Delta in Mali. The Clinic will also give participants the opportunity to look at some high-resolution LiDAR-based model results.Steve Roberts & Mariela Perignon
Australian National University & CU, CSDMS-IF
People attending: 20Hydrodynamic modeling using the open source package ANUGA ANUGA is an open source software package capable of simulating small-scale hydrological processes such as dam breaks, river flooding, storm surges and tsunamis. ANUGA is a Python-language model that solves the Shallow Water Wave Equation on an unstructured triangular grid and can simulate shock waves and rapidly changing flows. It was developed by the Australian National University and Geosciences Australia and has an active developer and user community.
The package supports discontinuous elevation, or ‘jumps’ in the bed profile between neighbouring cells. This has a number of benefits. Firstly it can preserve lake-at-rest type stationary states with wet-dry fronts. It can also simulate very shallow frictionally dominated flow down sloping topography, as typically occurs in direct-rainfall flood models. A further benefit of the discontinuous-elevation approach, when combined with an unstructured mesh, is that the model can sharply resolve rapid changes in the topography associated with e.g. narrow prismatic drainage channels, or buildings, without the computational expense of a very fine mesh. The boundaries between such features can be embedded in the mesh using break-lines, and the user can optionally specify that different elevation datasets are used to set the elevation within different parts of the mesh (e.g. often it is convenient to use a raster digital elevation model in terrestrial areas, and surveyed channel bed points in rivers). The discontinuous-elevation approach also supports a simple and computationally efficient treatment of river walls. These are arbitrarily narrow walls between cells, higher than the topography on either side, where the flow is controlled by a weir equation and optionally transitions back to the shallow water solution for sufficiently submerged flows. This allows modelling of levees or lateral weirs which are much finer than the mesh size.
This clinic will provide a hands-on introduction to hydrodynamic modeling using ANUGA. We will discuss the structure and capabilities of the model as we build and run increasingly complex simulations involving channels and river walls. No previous knowledge of Python is required. Example input files will be provided and participants will be able to explore the code and outputs at their own pace.Mark Piper
CU, CSDMS-IF
People attending: 21BMI Live! Mark Piper (mark.piper@colorado.edu) and Eric Hutton (eric.hutton@colorado.edu)
CSDMS Integration Facility, University of Colorado, Boulder, CO
In software engineering, an interface is a set of functions with prescribed names, argument types, and return types. When a developer implements an interface for a piece of software, they fill out the details for each function while keeping the signatures intact. CSDMS has developed the Basic Model Interface (BMI) for facilitating the conversion of an existing model written in C, C++, Fortran, Python or Java into a reusable, plug-and-play component. By design, BMI functions are straightforward to implement. However, when trying to match BMI functions to model behaviors, the devil is often in the details.
In this hands-on clinic, we'll take a simple model--an implementation of the two-dimensional heat equation in Python--and together, we'll write the BMI functions to wrap it, preparing it for transformation into a component. As we develop, we’ll explore how to use the wrapped model with a Jupyter Notebook.
To get the most out of this clinic, come prepared to code! We'll have a lot to write in the time allotted for the clinic. We recommend that clinic attendees have a laptop with the Anaconda Python distribution installed. We also request that you read over:
BMI description (https://csdms.colorado.edu/wiki/BMI_Description)
BMI documentation (http://bmi-python.readthedocs.io)
before participating in the clinic.Nicole Gasparini
Tulane University
People attending: 29Landlab with Hydroshare Landlab is a Python toolkit for building, coupling, and exploring two-dimensional numerical models of Earth-surface dynamics. Hydroshare is an online collaborative environment for sharing data and models. Hydroshare allows users to run models remotely, without needing to install software locally. This clinic will illustrate example Landlab models and how to run them on Hydroshare. This clinic will provide an introduction to Landlab’s features and capabilities, including how to create a model grid, populate it with data, and run numerical algorithms for surface hydrology, hillslope sediment transport, and stream incision. We will illustrate how models can be used for both research and teaching purposes. Katy Barnhart
CU, CIRES
People attending: 23Model sensitivity analysis and optimization with Dakota and Landlab Dakota is a flexible toolkit with algorithms for parameter optimization, uncertainty quantification, parameter estimation, and sensitivity analysis. In this clinic we will cover the basics of the Dakota framework, work through examples of using Dakota to compare field observations with model output using methods of sensitivity analysis and parameter optimization, and briefly cover the theoretical background of the Dakota methods used. If time permits, we will examine how the choice of comparison metrics influences results. Methods will be presented in the context of the Landlab Earth-surface dynamics framework but are generalizable to other models. Participants who are not familiar with Landlab are encouraged (but not required) to sign up for the Landlab clinic, which will take place before this clinic.
Participants do not need to install Landlab or Dakota prior to the clinic but will need to sign up for a Hydroshare account. https://www.hydroshare.org/sign-up/.
For those students interested in installing Landlab or Dakota: Installation instructions for Landlab can be found at: http://landlab.github.io (select "Install" from the menu bar at the top of the page). Installation instructions for Dakota can be found at https://dakota.sandia.gov/content/install-dakota.Cam Wobus & Mark Lorie
ABT Associates
People attending: 24
Max attendees: 30. Closed!Physical and Socio-Economic Data for Natural Hazards In this workshop we will explore publicly available socioeconomic and hydrologic datasets that can be used to inform riverine flood risks under present-day and future climate conditions. We will begin with a summary of different stakeholders’ requirements for understanding flood risk data, through the lens of our experience working with federal, state and local clients and stakeholders. We will then guide participants through the relevant data sources that we use to inform these studies, including FEMA floodplain maps, census data, building inventories, damage functions, and future projections of extreme hydrologic events. We will gather and synthesize some of these data sources, discuss how each data source can be used in impact analyses; and discuss the limitations of each available data source. We will conclude with a brainstorming session to discuss how the scientific community can better produce actionable information for community planners, floodplain managers, and other stakeholders who might face increasing riverine flood risks in the future. Doug Edmonds & Samapriya Roy
Indiana University, Bloomington
People attending: 40
Max attendees: 40. Closed!An Introduction to using Google Earth Engine In this clinic we will explore how to use the new cloud-based remote sensing platform from Google. Our hands-on clinic will teach you the basics of loading and visualizing data in Earth Engine, sorting through data, and creating different types of composite images. These techniques are a good starting point for more detailed investigations that monitor changes on earth’s surface. Prerequisites:
1) Bring your own laptop.
2) Chrome installed on your system: It will work with Firefox but has issues.
3) An active Google account - Register for an account with Google Earth Engine (https://earthengine.google.com/signup/)Ethan Gutmann
NCAR
People attending: 25
Max attendees: 30. Closed!Making Use of Climate Model Output: Downscaling for Regional Applications Getting usable information out of climate and weather models can be a daunting task. The direct output from the models typically has unacceptable biases on local scales, and as a result a large number of methods have been developed to bias correct or downscale the climate model output. This clinic will describe the range of methods available as well as provide background on the pros and cons of different approaches. This will cover a variety of approaches from relatively simple methods that just rescale the original output, to more sophisticated statistical methods that account for broader weather patterns, to high-resolution atmospheric models. We will focus on methods for which output or code are readily available for end users, and discuss the input data required by different methods. We will follow this up with a practical session in which participants will be supplied a test dataset and code with which to perform their own downscaling. Participants interested in applying these methods to their own region of interest are encouraged to contact the instructor ahead of time to determine what inputs would be required. Chris Jenkins & Jeff Obelcz
University of Colorado, Boulder & NRL, Stennis
People attending: 38Forum on Artificial Intelligence & Machine Learning: What lies ahead for Earth Surface Modeling ? The CSDMS 2018 Annual Meeting will include a forum on the subject of Artificial Intelligence (AI) and Machine Learning (ML) as they may affect Earth Surface Dynamics Modeling in the future. The objective is to gauge the interest and existing expertise among the participants of the 2018 ‘Hazards’ meeting, with a view to perhaps forming a working group embedded in CSDMS.
AI and ML are already in use in our field, principally for landscape classification and data interpolation. But they are also already heavily established in predictive modelling for the weather, and for biological and socio-economic fields, for example. This forum attempts to look forward and see how these new developments may affect our science and application of that science. The relationship between AI&ML and process modeling is likely to be a special point of discussion.
The 2hour forum will include a series of lightning presentations, and printed plus online display materials. It will discuss whether to, and how to create a formal working group on the subject within the CSDMS community, and what the activities should be.Chris Sherwood
USGS
People attending: 45How to make accurate digital elevation models using imagery from drones (or even walking around) Modern photogrammetry allows us to make very accurate three-dimensional models using images from consumer-grade cameras. Multiview stereo photogrammetry, also known as structure from motion (SfM) is now easily accessible. Coupled with drones, this is transformative technology that lets us all make better maps than the National Geodetic Survey could not long ago. This hands-on course will demonstrate the basic tools and provide some tips that will allow you to map your favorite field area with 3 - 5 cm horizontal resolution and vertical RMS errors of less than 10 cm. Even better resolution can be obtained for smaller areas, such as outcrops, archaeological digs, or your daughter's art project.
We will use Agisoft Photoscan Pro software...please download the free demo (Pro) version before the class. It works equally well on Mac, Windows, and Linux. If you have a choice, chose a machine with an NVidia graphics card. We encourage you to collect a set of images to bring to the class. Guidelines on how best to take images intended for SfM will be send around before the meeting.
Participants
Who is registered as of 02/27/2026?
- Participants meeting
- Submitted abstracts
- Participants bootcamp May 22th
- Participants HPC workshop May 22th
- Participants hackathon May 26th
Reimbursement
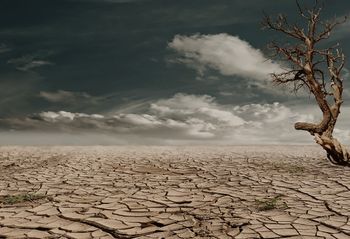
Within its budget, CSDMS intends to partially support member applicants to attend the annual meeting. Towards this goal, we encourage members to fully or partially cover their expenses if capable. We additionally thank those in the industry and agency fields for understanding that 1) we cannot compensate federal agency participants since our own funding is from NSF, and 2) we request that our industrial/ corporate participants cover their own costs thereby allowing more academic participants to attend. Because CSDMS is in a bridge year between CSDMS 2.0 and CSDMS 3.0, the funding structure for this meeting is different that previous spring meetings. Please note the resulting changes to reimbursement and meeting support as detailed below.
CSDMS is able to provide the following meeting support:
Participants and Poster Presenters - lodging will be provided at the designated meeting hotel (for the evenings of May 21st, 22nd and 23rd, shared rooms at 100% of cost and single rooms at 50% of cost), breakfast and lunch each day of the meeting and one dinner, shuttle service between meeting hotel and meeting venue. This support is available for registrations received through April 1, 2018 or until 100 registrations have been received. After the April 1st deadline, lodging reservations and costs will be the responsibility of the participant.
Scholarship recipients, Keynote presenters, Clinic leaders and Awardees - travel support, registration support and lodging as specified in your invitation letter, breakfast and lunch each day of the meeting and one dinner, shuttle service between meeting hotel and meeting venue.
Specific reimbursement procedures will be emailed to qualified attendees along with your final confirmation in early May, 2018.
Important for foreign travelers: If you need a visa to travel to USA, select a business visa. Please email csdms@colorado.edu as soon as possible if you need an invitation letter and indicate any specific wording required. We will need to copy the entry stamp in your passport sometime during the meeting as proof that you were here on business as required by US tax laws (especially when dealing with airfare reimbursements). We are only able to provide reimbursement for airfare within the U.S. and in airlines that are U.S. flag carriers.
Travel, Lodging and Conference Center Information
The meeting will be held at SEEC
Hotel: Millennium Harvest House Hotel Transportation: You can book transportation between DIA and Boulder here: Green Ride Boulder. And information on how to find Green Ride Boulder at DIA.
We will provide a bus between the designated Hotel and the meeting venue each day (the shuttle is not able to stop at other area hotels). We will also provide transportation from the designated Hotel to the banquet (again, the shuttle is not able to stop at other area hotels). Please note that the parking adjacent to the SEEC building now requires payment for non-permit holders. You will need to park in the limited designated areas and provide payment in the adjacent kiosks.
Pre-conference events
The following will apply to both the Software Carpentry bootcamp and the HPC workshop pre-conference events:
- Registration is open until April 2nd (or until program fills) and is handled through the 2018 meeting site.
- Each is capped at 30 participants (first paid first serve), and it has a $30 registration fee.
- Participant will be responsible for cost / organization of their extra day of hotel accommodation and dinner. Costs will not be reimbursed.
- We will cover coffee, continental breakfast and lunch during each of the events.
Software Carpentry bootcamp
CSDMS will host a one-day pre-conference Software Carpentry bootcamp on Monday May 21nd, 2018, led by Mariela Perignon and Mark Piper.
The objective of the bootcamp is to teach basic programming skills that are useful for scientific computing and model development. This is an intensive, hands-on workshop for novice programmers and those with minimal experience in the specific topics covered. Instructors will cover basic elements of:- the Unix bash shell,
- Python programming with Numpy, and
- Github for version control.
Our instructors are earth scientists and have familiarity with the CSDMS framework. Lessons and examples will be targeted toward relevant problems in the geosciences. The bootcamp intentionally precedes the CSDMS meeting, so the skills participants develop should be useful in the clinics during the meeting.
HPC workshop
CSDMS will host a one-day pre-conference HPC workshop Essentials for HPCC model code on Monday May 21nd, 2018, led by Thomas Hauser and his HPC Research Computing team.
The objective of the workshop is to teach all essential programming skills to optimal use a HPCC. This will be an hands-on workshop.
Post-conference BMI Hackathon
CSDMS will host a one-day post-conference hackathon on Friday May 25th, 2018, organized by Eric Hutton and Mark Piper.
A hackathon is loosely defined as a social gathering with the goal of collaboratively creating usable software. Here, we’ll hack BMIs. A BMI-ed model can be converted into a CSDMS component, which allows it to be called from PyMT and included in WMT, thereby increasing its visibility and use.Each attendee is invited to bring a model of their choice1 to wrap with a BMI. The model can be in any CSDMS-supported language (C, C++, Fortran, Java, Python). Attendees should be proficient in the language of their chosen model. The attendees will work together to add BMIs to models. CSDMS staff will guide participants and provide technical assistance. The ultimate goal of the hackathon is to get each participant's model wrapped with a BMI. This is a lofty goal. The more likely outcome is that each participant will have a good start on getting their model wrapped.
Before the hackathon, attendees are expected to have read:- BMI description
- BMI specification (http://bmi-spec.readthedocs.io)
- BMI documentation (http://bmi-python.readthedocs.io)
and to have attended a BMI clinic in the current or in an earlier year. Attendees need a laptop with either a working compiler for the language of their choice or an account on beach. To make the most of the hackathon, attendees should attempt to prepare their model for a BMI by refactoring it into initialize (sets the initial state of the model), update (advances the model by one time step), and finalize (shuts down the model) subprograms.
1 If an attendee doesn’t have a model to wrap, but does express a language preference, we will provide them with a simple model in their language that they can wrap; however, attendees who bring their own model will have precedence if space is an issue.Note:
- Registration is open until April 2st (or until the program fills) and is handled through the 2018 meeting site.
- The hackathon is capped at 12 participants (first paid first served), and it has a $30 registration fee.
- Participants will be responsible for cost / organization of their extra day of hotel accommodation and dinner. Costs will not be reimbursed.
- We will cover coffee, continental breakfast and lunch during the hackathon.
Syvitski Student Modeler Award 2018
We are pleased to announce that Julio Hoffimann Mendes of Stanford University has won the Syvitski Student Modeler Award of 2018, with his work on Stochastic simulation by image quilting of process-based geological models. Julio will present his work during the Geoprocesses, Geohazards – CSDMS 2018 meeting.
Julio Hoffimann Mendes
Student Scholarships
This year CSDMS is offering a limited number of scholarships (up to 5) for graduate students to attend the CSDMS annual meeting. These scholarships will be offered for the purpose of increasing participation of underrepresented students or those that have not previously attended. To be eligible, graduate students need to meet the following requirements:
- Attend the whole meeting (May 22-24, 2018)
- Submit an abstract
- Be enrolled as a graduate student at the time of the meeting (bring proof)
- Submit a letter of motivation that states why you wish to participate in the meeting, and explain how your participation would enhance diversity in the field of natural hazards and surface dynamics modeling. Be sure to mention if it is your first time attending.
Send your application materials to csdms@colorado.edu by February 19th, 2018. The CSDMS scholarships will cover:
- Registration costs (you will still need to pay the registration fee, but will be reimbursed after attending the meeting)
- Hotel accommodations for three nights, starting May 21nd. (as outlined in Travel/Lodging section above - 100% paid if you agree to a roommate)
- Travel (air fare ONLY within the United States and local shuttle transport)
- Per diem to help reimburse the cost of meals from 22-24 May 2018 not offered in the conference schedule
All applicants will receive confirmation of their submission. Please notify us at csdms@colorado.edu if you do not receive confirmation within 24 hours of submission.
Important dates
- January 14th: Registration opens
- January 15th: Deadline for student modeler competition submission
- January 31st: Student modeler competition results announced
- February 19th: Deadline for student scholarship applications CSDMS
- February 26th: Scholarship awardees notified
- April 1st: Deadline abstract submission, discounted early registration and meeting supported hotel reservations (unless our cap of 100 lodgers has already been met). After this deadline, reservations and accommodation costs will be responsibility of participant.
- May 14th: Deadline regular registration. Notice additional costs do apply.
- May 21nd: Optional: pre-conference bootcamp or HPC workshop
- May 22-24th: CSDMS annual meeting
- May 25th: Optional: post-conference hackathon
- May 25th: CSDMS Executive and Steering committees meetings (by invitation only)