Labs WMT River Sediment Supply
River Sediment Supply Modeling with HydroTrend
Introduction
HydroTrend is a 2D hydrological water balance and transport model that simulates water discharge and sediment load at a river outlet. You can read more about the model, find references or download the C source code at: https://csdms.colorado.edu/wiki/Model:HydroTrend.
Class Organization
In this lab, we are using a theoretical river basin of ~1990 km2, with 1200m of relief and a river length of ~100 km. All parameters that are shown by default once the HydroTrend Model is loaded are based on a present-day, temperate climate. Whereas these runs are not meant to be specific, we are using parameters that are realistic for the Waiapaoa River in New Zealand. The Waiapaoa River is located on North Island and receives high rain and has erodible soils, so the river sediment loads are exceptionally high. It has been called the 'dirtiest small river in the world'. A more detailed description of applying HydroTrend to the Waipaoa basin, New Zealand has been published in WRR: hydrotrend_waipaoa_paper. To learn more about HydroTrend and its approach to sediment supply modeling, you can download this presentation.
This lab will run HydroTrend simulation with Python Modeling Tool (Pymt). If you have never used the Pymt, learn how to use it here. The Pymt allows you to set up simulations and run notebooks.
If you are a faculty at an academic institution, it is possible to work with us to get temporary teaching accounts. Work directly with us by emailing: csdms@colorado.edu
Learning objectives
Skills
- use Pymt to run HydroTrend Model
- familiarize with a basic configuration of the HydroTrend Model
- make small changes to key input parameters
- hands-on experience with visualizing output in Python
Topical learning objectives:
- explore the HydroTrend base-case river simulation
- how does a river system respond to climate change
- how do human affect river sediment loads
Lab Notes
You can launch binder to directly run the Jupyter Notebook for this lab through a web browser.
>> Open a new browser window and open the Pymt read the docs page here
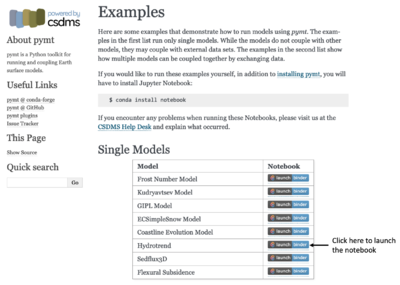
>> You will see that there are several example models. In this lab we will select the HydroTrend model.
>> Click on the 'Launch Binder' box and it will allow you to see this lab as a Jupyter Notebook.
>> You can execute the Jupyter notebook code cells using shift -enter.
Exercise 1: Explore the base-case river simulation
In this exercise, we will run a simulation for 100 years at daily time-step. You will learn how to:
(1) setup the model indicating the number of years to run
(2) initialize the model with the configure file
(3) code up time loop to update the model with each time step and save the output
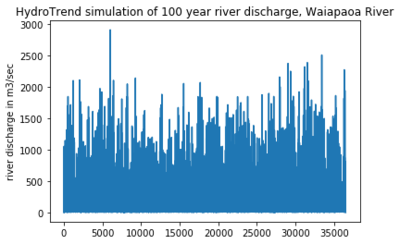
(4) plot the simulated output time series, for example the river discharge (see figure below)
After the model run, you will need to write code and finish the following assignments:
Assignment 1
Calculate mean water discharge Q, mean suspended load Qs, mean sediment concentration Cs, and mean bedload  Qb for this 100 year simulation of the river dynamics of the Waiapaoa River.
Note all values are reported as daily averages. What are the units?
Assignment 2
Identify the highest flood event for this simulation. Is this the 100-year flood? Please list a definition of a 100 year flood, and discuss whether the modeled extreme event fits this definition.
Plot the year of Q-data which includes the flood.
Assignment 3
Calculate the mean annual sediment load for this river system.

Then compare the annual load of the Waiapaoha river to the Mississippi River.
To compare the mean annual load to other river systems you will need to calculate its sediment yield.
Sediment Yield is defined as sediment load normalized for the river drainage area;
so it can be reported in T/km2/yr.
Exercise 2: How does a river system respond to climate change; a few simple scenarios for the coming century.
In this exercise, we will look at changing climatic conditions in a small river basin. We'll change temperature and precipitation regimes and compare discharge and sediment load characteristics to the original base case. And we will look at the potential implications of changes in the peak events.
HydroTrend runs at daily timestep, and thus can deal with seasonal variations in temperature and precipitation for a basin. The model ingests monthly mean input values for these two climate parameters and their monthly standard deviations, ideally the values would be derived from analysis of a longterm record of daily climate data. You can adapt seasonal trends by using the monthly values.
With the following assignments, you will learn how to change the model parameters and set up new model runs to explore how a river system responds to different climate scenarios.
Assignment 4
Explore the effect of a warming climate. What happens to river discharge, suspended load and bedload if the mean annual temperature in this specific river basin increases by 4 °C over the next 50 years?
In this assignment we set up a new simulation for a warming climate.
Assignment 5
Explore the effect of a warming basin temperature.
How much increase or decrease of river discharge do you see after 50 years?
How is the mean suspended load affected?
How does the mean bedload change?
What happens to the peak event; look at the maximum sediment load event of the last 5 years of the simulation?
Assignment 6
What happens to river discharge, suspended load and bedload if the mean annual precipitation would increase by 50% in this specific river basin over the next 50 years? Create a new simulation folder, High Precipitation, HP, and set up a run with a trend in future precipitation.
Assignment 7
In addition, climate model predictions indicate that perhaps precipitation intensity and variability could increase.
How would you model this; discuss all your input settings for precipitation.
Exercise 3: How do humans affect river sediment loads?
Here we will look at the effect of human in a river basin. Humans can accelerate erosion processes, or reduce the sediment loads traveling through a river system. Both concepts can be simulated, first run 3 simulations systematically increasing the anthropogenic factor (0.5-8.0 is the range).
Assignment 8
Describe in your own words the meaning of the human-induced erosion factor, (Eh) (Syvitski & Milliman, 2007).
This factor is parametrized as the  “Antropogenic” factor in HydroTrend. See references for the paper.
Bonus Assignment 9
Model a scenario of a drinking water supply reservoir to be planned in the coastal area of the basin. The reservoir would have 800 km 2of contributing drainage area and be 3 km long, 200m wide and 100m deep. Set up a simulation with these parameters.
Bonus Assignment 10
Set up a simulation for a different river basin. This means you would need to change the HYDRO0.HYPS file and change some climatic parameters. There are several hypsometric files packaged with HydroTrend, you can use one of those, but are welcome to do something different!


