Science on a Sphere: Difference between revisions
No edit summary |
No edit summary |
||
| Line 11: | Line 11: | ||
==CSDMS developed SOS datasets== | ==CSDMS developed SOS datasets== | ||
<table> | <table> | ||
<tr> <td valign= | <tr> <td valign=center width="70%">[http://sos.noaa.gov/Datasets/dataset.php?id=472 Dams and Reservoirs 1800-2010]</td> | ||
<td valign=top width="30%">[[Image:Dams-globe.png|100px|center|link=http://sos.noaa.gov/Datasets/dataset.php?id=472]]</td></tr> | <td valign=top width="30%">[[Image:Dams-globe.png|100px|center|link=http://sos.noaa.gov/Datasets/dataset.php?id=472]]</td></tr> | ||
<tr><td colspan=3><hr style="border:dashed #ffffff;border-width:1px 0 0; height:0;" /></td></tr> | <tr><td colspan=3><hr style="border:dashed #ffffff;border-width:1px 0 0; height:0;" /></td></tr> | ||
Revision as of 20:48, 2 October 2014
Science on a Sphere, October 2014
You can now visit your local Science on a Sphere® and be in awe with the damming of the world’s rivers, or see how waves in the Atlantic Ocean developed during Hurricane Sandy. Over the last couple of months, CSDMS has been developing Science on a Sphere (SOS) datasets. The first datasets with lesson material are now posted!
We show how dams spread worldwide, with peak development in the 1950’s. We highlight dam building over time for two large river basins, the Mississippi River basin in the USA, and the Yangtze River basin in China.
Another set of animations was developed from the WaveWatch III® data to show wave power and wave height in the global oceans for the year 2012. Two detailed animations highlight waves during hurricane Katrina and Sandy, so high they even wiped out a buoy in the Gulf of Mexico.
Find out whether there is a museum near you that has one of these giant animated globes http://sos.noaa.gov/What_is_SOS/sites.php here.
Even when you find out there is no globe anywhere near, you can go to the Science on a Sphere website and instead just view and download the animations for use in the classroom.
CSDMS developed SOS datasets
| Dams and Reservoirs 1800-2010 | 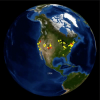 | |
Dams and Reservoirs of the Mississippi 1800-2010
http://sos.noaa.gov/Datasets/dataset.php?id=476
Dams and Reservoirs of the Yagtze River 1800-2010 http://sos.noaa.gov/Datasets/dataset.php?id=477
Wave Power over 2012 http://sos.noaa.gov/videos/wave_power_400.mov
Wave heights during Hurricane Sandy 2012 http://sos.noaa.gov/Datasets/dataset.php?id=489
Wave heights during Hurricane Katrina http://sos.noaa.gov/Datasets/dataset.php?id=490
We have a number of additional datasets to work on, and will work with the CSDMS community to contribute a range of movies to the Science on a Sphere repository. It is worth your time to make these, 33 million people see Science On a Sphere® every year! Feel free to contact CSDMS EKT: irina.overeem@colorado.edu
