Revision as of 10:03, 15 December 2020 by Ale37911(talk | contribs)(Created page with "{{Labbasics |Labtitle=Tilt Current Meter Analyses |LabCOModule=1 of 1 |LabDateContributedOrUpdated=2020-10-27 |LabDescriptionShort=Analyze month long deployment of velocity da...")
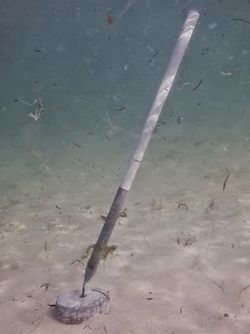
We will be analyzing the data from a month long deployment of a Lowell Tilt Current Meter: https://lowellinstruments.com/products/tcm-1-tilt-current-meter/. These meters were deployed at the boat ramp of Bog Stream in North Pond, Maine (44.647773, -69.865923) from Sept. 25th 2020 - Oct. 22, 2020 as part of a final project for GE 254 at Colby College in conjunction with the 7-lakes alliance (https://www.7lakesalliance.org/).
Classroom organization This was used as a lab to analyze velocity data from a month long deployment in a nearby stream. It was used as part of a final group project students were doing and to further their introduction and comfort with python and pandas dataframes.
Learning objectives Skills
Importing, analyzing, and visualizing time-series data
Cleaning up raw data
Averaging burst data
Exploring potential drivers of velocity changes at our site (meteorological)
Key concepts
Averaging Time-series data at different frequencies
Importing long-temporal data series
learn how to make more complicated plots in python: 2 y-axes or using color of markers to denote a 3rd variable
learn how to utilize date-time objects in pandas to work FOR you in time-series analyses