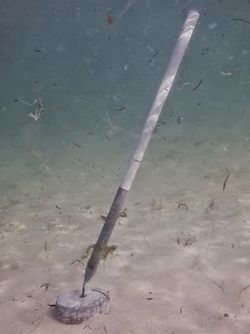
Lab-0022
Tilt Current Meter Analyses
Contributor(s)

Classroom organization
This was used as a lab to analyze velocity data from a month long deployment in a nearby stream. It was used as part of a final group project students were doing and to further their introduction and comfort with python and pandas dataframes.
Skills
- Importing, analyzing, and visualizing time-series data
- Cleaning up raw data
- Averaging burst data
- Exploring potential drivers of velocity changes at our site (meteorological)
- Averaging Time-series data at different frequencies
- Importing long-temporal data series
- learn how to make more complicated plots in python: 2 y-axes or using color of markers to denote a 3rd variable
- learn how to utilize date-time objects in pandas to work FOR you in time-series analyses
Lab notes
Make sure students have some understanding of how a TCM (tilt current meter) works - https://www.lowellinstruments.com/download_files/Universal_User_Guide.pdf
Please go here for the scripts and files used: https://github.com/ale37911/CSDMS_Labs/tree/main/TCM.
This lab can be run on the explore (for educators) and jupyter (for general use) instances of EarthscapeHub: just click one of the links under the Run online using heading at the top of this page, then run the notebook in the "CSDMS" kernel.
If you don't already have an EarthscapeHub account, follow the instructions to sign up at https://csdms.colorado.edu/wiki/JupyterHub. If you're an educator, you can get EarthscapeHub accounts for you and your students--please contact us through the CSDMS Help Desk: https://csdms.github.io/help-desk.
Note that the data files required for the lab have been uploaded to EarthscapeHub and placed in the directory /data/TCM_data_CSDMS_Ex; the Notebook will need to be updated with this path. Also note the Notebook uses about 5 GB of memory, so it's possible to run out of memory if many people are using the JupyterHub simultaneously.
Requirements
If run locally, this lab requires the installation of the Python numpy, pandas, and matplotlib packages. You will also need TCM output data files and a local weather output (I manually cleaned that file of all header information). Download these files from https://drive.google.com/drive/folders/1vKAZbYs3rJGVF2ULqCK0ulcq7qmsTsAi.
Acknowledgements
CSDMS and Mark Piper helped me create and host these labs on EarthscapeHub.
References
