Lab-0012: Difference between revisions
No edit summary |
No edit summary |
||
| Line 17: | Line 17: | ||
}} | }} | ||
{{LabIntro | {{LabIntro | ||
|LabDescription=Topical | |LabDescription=Topical Learning Objectives | ||
# | # Concepts of river discharge and stage | ||
# | # What are stage-discharge relationships? | ||
# | # What are some difficulties for relating stage to discharge? | ||
Python Skill Learning Objectives: | Python Skill Learning Objectives: | ||
# Load csv data from a file using the | # Load csv data from a file using the ''pandas'' library | ||
# Access data in | # Access data in a DataFrame | ||
# Create plots of data | # Create plots of data from a DataFrame | ||
# Save | # Save plots to a file | ||
|LabPicture=RiverDischargeTimeseries.png | |LabPicture=RiverDischargeTimeseries.png | ||
}} | }} | ||
{{LabClassroomOrganization | {{LabClassroomOrganization | ||
|LabCOIntro= | |LabCOIntro=This lab is appropriate for advanced undergraduates and graduate students majoring in earth science/engineering. | ||
We will be looking at data on river discharge - the volume of water transported through a given cross section per time- of the Colorado River. | We will be looking at data on river discharge -- the volume of water transported through a given cross section per time -- of the Colorado River. | ||
This | This Notebook lends itself to a short introduction on the concept of river discharge, how it is measured and an introduction on gauging stations of the USGS. | ||
The data analysis part requires basic | The data analysis part requires basic Python data handling skills, but the coding is introductory level. | ||
Students can run through | Students can run through the Notebook and are encouraged to do assignments by themselves (or as homework). A review and discussion of solutions by the instructor after completion by the participants is recommended. | ||
This lab can be run on the CSDMS JupyterHub; follow the instructions on [[JupyterHub|this page]] to sign up for an account. Once approved, run the Notebook by clicking on the "start" link under the '''Run online''' heading at the top of this page. | |||
page | |||
|LabCOPresentationUpload=RiverStageDischargeIntroduction.pdf | |LabCOPresentationUpload=RiverStageDischargeIntroduction.pdf | ||
|LabCOPresentationText=Concept Diagrams of Stage and Discharge Measurements | |LabCOPresentationText=Concept Diagrams of Stage and Discharge Measurements | ||
}} | }} | ||
{{LabLearningObjectivesSkills | {{LabLearningObjectivesSkills | ||
|LabSkill=Load csv data from a file using the | |LabSkill=Load csv data from a file using the ''pandas'' library | ||
}} | }} | ||
{{LabLearningObjectivesSkills | {{LabLearningObjectivesSkills | ||
|LabSkill=Access data in | |LabSkill=Access data in a DataFrame | ||
}} | }} | ||
{{LabLearningObjectivesSkills | {{LabLearningObjectivesSkills | ||
|LabSkill=Create plots of data | |LabSkill=Create plots of data from a DataFrame | ||
}} | }} | ||
{{LabLearningObjectivesSkills | {{LabLearningObjectivesSkills | ||
|LabSkill=Save | |LabSkill=Save plots to a file | ||
}} | }} | ||
{{Headerplaceholder}} | {{Headerplaceholder}} | ||
Revision as of 16:16, 24 August 2020
River Discharge Data Analysis
Contributor(s)

- Concepts of river discharge and stage
- What are stage-discharge relationships?
- What are some difficulties for relating stage to discharge?
Python Skill Learning Objectives:
- Load csv data from a file using the pandas library
- Access data in a DataFrame
- Create plots of data from a DataFrame
- Save plots to a file
Classroom organization
[[LabCOIntro::This lab is appropriate for advanced undergraduates and graduate students majoring in earth science/engineering.
We will be looking at data on river discharge -- the volume of water transported through a given cross section per time -- of the Colorado River. This Notebook lends itself to a short introduction on the concept of river discharge, how it is measured and an introduction on gauging stations of the USGS. The data analysis part requires basic Python data handling skills, but the coding is introductory level.
Students can run through the Notebook and are encouraged to do assignments by themselves (or as homework). A review and discussion of solutions by the instructor after completion by the participants is recommended.
This lab can be run on the CSDMS JupyterHub; follow the instructions on this page to sign up for an account. Once approved, run the Notebook by clicking on the "start" link under the Run online heading at the top of this page.]]Download associated file: RiverStageDischargeIntroduction.pdf
Concept Diagrams of Stage and Discharge Measurements
Skills
- Load csv data from a file using the pandas library
- Access data in a DataFrame
- Create plots of data from a DataFrame
- Save plots to a file
- River discharge and stage
- Stage-discharge relationship
Lab notes
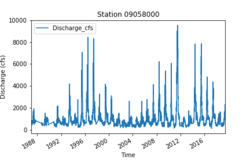
We will be looking at data on river discharge - the volume of water transported through a given cross section per time- of the Upper Colorado River.
River discharge data for many US rivers is available from the USGS water watch website: http://waterwatch.usgs.gov/?m=real&r=co
River stage data is typically measured by keeping track of the water surface height over time, i.e. stage, and this needs to be converted to discharge through a stage-discharge relationship.
Tabular data like this data with a combination of dates, name and data quality strings, and numbers are best handled by spreadsheets where entries such as dates and times are in some useful format. In Python the Python Data Analysis Library (a.k.a. Pandas) is really useful for this purpose.
We use one discharge data file downloaded for the USGS station at Kremmling, CO, for the Upper Colorado.Acknowledgements
CSDMS, NSF Award
References
