Lab-0010: Difference between revisions

From CSDMS
No edit summary
No edit summary
Line 24: Line 24:
{{LabNotes
{{LabNotes
|LabNotesInstructions=Students read and run the notebook, adding code of their own at the end to experiment with different parameters.
|LabNotesInstructions=Students read and run the notebook, adding code of their own at the end to experiment with different parameters.
|LabNotesFigure=n/a
|LabNotesFigureCaption=n/a
|LabNotesRequirements=n/a
}}
}}

Revision as of 08:01, 31 May 2020

Soil temperature profile

Duration
1.0 hrs
Updated
2020/04/07
Download
download
Run online using:
     

Contributor(s)
    Gregory Tucker at CIRES, CSDMS, and Geological Sciences, University of Colorado, Boulder.

Introduction
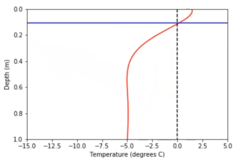
This lab is useful for visualizing conductive heat flow in soil or rock, as the surface temperature varies. The notebook includes a simple 1D model of temperature evolution in a soil profile, and provides students with guidance on how to run the model and explore parameters.

Classroom organization
n/a

Learning objectives
Skills
Key concepts

Lab notes
Students read and run the notebook, adding code of their own at the end to experiment with different parameters.

References