CSDMS 2015 annual meeting poster ZhenCheng
A Turbulence-resolving Eulerain Two-Phase Model for Sediment Transport Applications
Xiao Yu, University of Delaware, Delaware, United States.
Tian-Jian (Tom) Hsu, University of Delaware, Delaware, United States.
Abstract:
Coastal morphological evolution is caused by a wide range of coupled cross-shore and alongshore sediment transport processes associated with short waves, infragravity waves, wave-induced currents. However, the fundamental transport mechanisms occur within bottom boundary layer dictated by turbulence-sediment interaction and inter-granular interactions. In the past decade, significant research efforts have been made in modeling sediment transport using Eulerian-Eulerian or Eulerian-Lagrangian two-phase flow approach. However, most of these models are limited to one-dimensional-vertical (1DV) formulation which is only applicable to Reynolds-averaged sheet flow condition. Therefore, complex processes such as turbulence-resolving features, momentary bed failure and bedform dynamics, cannot be investigated. The main objective of this study is to develop a multi-dimensional four-way coupled two-phase model for sediment transport that can be used for Reynolds-averaged study for large-scale applications or for turbulence-resolving simulations at small-scale.
Following the two-phase flow formulation for sediment transport of Hsu et al. (2004), the numerical model is developed using the open-source CFD toolbox, OpenFOAM by reviving the two-phase Eulerian flow solver of Rusche (2002). The Reynolds-averaged version of the present model has been validated with available laboratory data for sheet flow condition (Cheng et al., 2014) and disseminated as an open-source code via Community Surface Dynamics and Modeling System (CSDMS). This study further report our ongoing effort to validate the 3D turbulence-resolving version of the two-phase model for sheet flow and to study sediment burst events often observed during flow reversal. Large eddy simulation (LES) concept is adopted in the present study. Figure 1 presents the 3D snapshots of iso-surface of sediment concentration during flow peak and flow reversal. In each panel, the blue iso-surface represents high sediment concentration of 30%, while the green iso-surface represents dilute concentration of 0.1%. We can see that during flow peak (Figure 1(a)), the distance between these two iso-surfaces is larger, suggesting a large sheet flow layer thickness. There is mild spatial variation due to turbulent eddies. On the other hand, during flow reversal (Figure 1(b)), the averaged distance between these two iso-surfaces becomes much smaller. However, we observe much significant spatial variation. Locally, we have sediment bursts penetrating upward for about 2~3 cm. Simulation results presented here are similar to a few oscillating water tunnel measurements where burst events are only observed during flow reversal for sufficiently fine sand (Dohmen-Janssen et al. 2002). More comprehensive model validation and model application for sediment transport will be discussed in the conference.
References:
Z. Cheng and T.-J. Hsu. A multi-dimensional two-phase eulerian model for sediment transport — twophaseeulersedfoam (version 1.0). Technical Report No. CACR-14-08, University of Delaware, August 2014.
Dohmen-Janssen, C. M., Hanes, D. M., Oct. 2002. Sheet flow dynamics under monochromatic nonbreaking waves. J. Geophys. Res. 107 (C10), 3149. doi:10.1029/2001JC001045, 2002.
Hsu, T.-J., Jenkins, J. T., Liu, P. L.-F., 2004. On two-phase sediment trans- port: sheet flow of massive particles. Proceedings of the Royal Society of London. Series A: Mathematical, Physical and Engineering Sciences 460 (2048), 2223–2250.
Rusche, H., 2002. Computational fluid dynamics of dispersed two-phase flows at high phase fractions. Ph.D. thesis, Imperial College London (University of London).
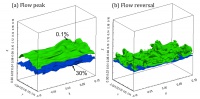
Figure 1: 3D turbulence-resolving simulation of fine sand transport in oscillatory flow with velocity amplitude 1.5 m/s and T=5.0 sec. Snapshots of iso-surface of sediment concentration during (a) flow peak and (b) flow reversal. The green iso-surface represent volumetric concentration of 0.1% and the blue iso-surface represent 30%.
* Please acknowledge the original contributors when you are using this material. If there are any copyright issues, please let us know and we will respond as soon as possible.
