File:ERT-based Permafrost Island.png: Difference between revisions
From CSDMS
Fig. 1 ERT measurements conducted in 31/07/2015 with an electrode probe interval of 5 m. Permafrost island are roughly determined by the resistivity contour of 1010 Ω, which is the resistivity value at the interface of frozen/unfrozen. Borehole locati... |
(No difference)
|
Latest revision as of 08:22, 30 March 2017
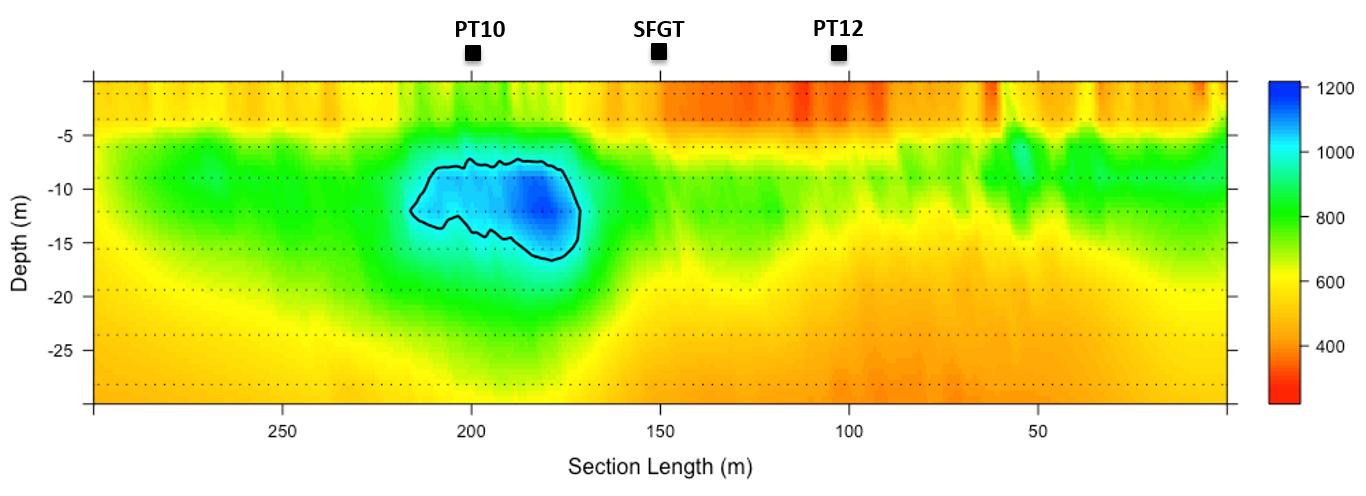
Fig. 1 ERT measurements conducted in 31/07/2015 with an electrode probe interval of 5 m. Permafrost island are roughly determined by the resistivity contour of 1010 Ω, which is the resistivity value at the interface of frozen/unfrozen. Borehole locations are marked by black square.
File history
Click on a date/time to view the file as it appeared at that time.
| Date/Time | Thumbnail | Dimensions | User | Comment | ||
|---|---|---|---|---|---|---|
| delete all | current | 08:22, 30 March 2017 | 1,366 × 496 (256 KB) | Bin Cao (talk | contribs) | Fig. 1 ERT measurements conducted in 31/07/2015 with an electrode probe interval of 5 m. Permafrost island are roughly determined by the resistivity contour of 1010 Ω, which is the resistivity value at the interface of frozen/unfrozen. Borehole locati... |
You cannot overwrite this file.
File usage
The following page uses this file:
