Lab-0010
From CSDMS
Soil temperature profile
Contributor(s)
Gregory Tucker at CIRES, CSDMS, and Geological Sciences, University of Colorado, Boulder.
Introduction
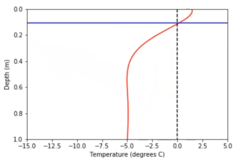

This lab is useful for visualizing conductive heat flow in soil or rock, as the surface temperature varies. The notebook includes a simple 1D model of temperature evolution in a soil profile, and provides students with guidance on how to run the model and explore parameters.
Classroom organization
Lab is designed for undergraduate students majoring in earth sciences (hydrology, environmental sciences, glaciology, atmosphere and ocean sciences). The notebook is demonstration style and gives participants the possibility to explore interactively.
Learning objectives
Skills
Skills
- basic plotting with the Python matplotlib library
Key concepts
- phase relationship between soil and air temperature
- temperature diffusion
- effects of diurnal and seasonal forcing
Lab notes
Students read and run the notebook, adding code of their own at the end to experiment with different parameters.
This lab can be run on the CSDMS JupyterHub. (If you don't already have an account, follow the instructions to sign up at: https://csdms.colorado.edu/wiki/JupyterHub.) Run the lab Notebook by clicking the "start" link under the Run online heading at the top of this page. If you're an educator using this lab in a class, you can get CSDMS JupyterHub accounts for students. For more information, please contact us through the CSDMS Help Desk: https://github.com/csdms/help-desk.
Requirements
If run locally, this lab requires the installtion of the Python packages numpy, matplotlib, and ffmpeg.
References
