Lab-0010: Difference between revisions
From CSDMS
No edit summary |
No edit summary |
||
| Line 24: | Line 24: | ||
{{LabNotes | {{LabNotes | ||
|LabNotesInstructions=Students read and run the notebook, adding code of their own at the end to experiment with different parameters. | |LabNotesInstructions=Students read and run the notebook, adding code of their own at the end to experiment with different parameters. | ||
}} | }} | ||
Revision as of 08:01, 31 May 2020
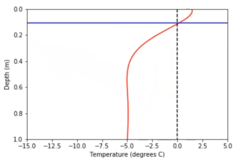
Soil temperature profile
Contributor(s)
Gregory Tucker at CIRES, CSDMS, and Geological Sciences, University of Colorado, Boulder.
Classroom organization
n/a
Learning objectives
Skills
Skills
Key concepts
Lab notes
Students read and run the notebook, adding code of their own at the end to experiment with different parameters.
References

