Seafloor Substrates
About dbSEABED
Summary
dbSEABED is a comprehensive database/GIS describing the seabed materials of the global ocean. It holds data describing about 2 million seafloor sites, and integrates that pointwise data using an Information Processing System that has diverse processing steps and options. A unique and advantageous feature is that word-based descriptive data about seafloor bottom type is parsed and brought into conformance with the analytical numeric data type, so that they become co-mappable. This gives the best possible geographic coverage and information richness from the available data.
dbSEABED deals with the grain size textures, strengths and porosities, carbon and carbonate compositions, colors, structural features, and grain components of the seafloor. The diverse inputs on these properties from thousands of individual datasets (currently 2074) are harmonized into one unified and calibrated set of outputs, which initially is pointwise but then is computed into grids and other visualizations. For quality assurance reasons, a significant amount (about 20%) of the original data from the diverse input datasets is not accepted to outputs.
The data input to dbSEABED is from public domain and collaborative sources across marine research (oceanography, geosciences, biology and chemistry) and marine operations (survey, fisheries, engineering, defence). The diversity in sources helps to obtain an unbiased, information rich coverage that extends across all marine zones.
dbSEABED has stratigraphic (subbottom) capabilities that are not addressed here. The complete lithologic datasets of the Ocean Drilling Program, Deep-Sea Drilling Project, and Lamont-Doherty Core Repository are entered.
The Project
Development of the system is based at INSTAAR, University of Colorado in Boulder. Partners at the USGS, LDEO at Columbia University, PIES at University of New Orleans, and UTIG at University of Texas Austin, Consortium of Ocean Leadership (CoL), and NGDC in NOAA (USA), BWB (Germany), Universities of Sydney and Adelaide, DSTO and CSIRO (Australia), also develop and validate the system data, dictionaries and software. Numerous institutions and individuals have shown foresight and generosity by providing sets of modern and legacy data to the system. Funding for dbSEABED has been provided by ONR, NSF, BWB, NOAA, DSTO, CSIRO, USGS, GSMFC, CoL.
More information on dbSEABED can be obtained from the Home Page, from the national usSEABED development by USGS. The Bibliography illustrates the scope for cross-disciplinary applications of the system in ocean research and stewardship. dbSEABED outputs are already in use for models of fisheries stocks, acoustic propagation, object burial, contaminants, sediment transport, and species habitat suitability.
Data for Modellers
The Gridded Data
For modeling applications gridded data is appropriate. Gridded data also helps in the communication of datasets between research and operational disciplines. But the choice of an appropriate gridding (interpolating) routine is important.
For this project the dbSEABED Competent Seafloor Interpolator was used, which applies the Inverse Distance Weighted mathematical method to judiciously searched data in order to produce geographically and ecologically reasonable results. For example, for each cell the data must be neighbouring by distance and isotropic (surrounding). The search radius shrinks as the coast is approached. In this way the gridding minimizes effects from the irregular distribution of the incoming point data. In addition, cells that hold data receive the median of that data, which preserves detail in the well-surveyed areas. Coupled parameters such as gravel/sand/mud are dealt with appropriately. The gridded results are especially good in coastal and archipelagic areas. Gridded quantitative uncertainties are also put out. Regions too distant from useable data are left blank, but may be filled client-side based on the CSI grid using any secondary, unspecialized gridding method from a commercial GIS. The maximum (open ocean) search radii are 20km for sediment parameters, 5km for rock.
Details of the grids
Gridded datasets will be added progressively to this site, with priority to areas of active modelling research and overall data availability from dbSEABED. A global gridding is being formed and will be released.
The gridded parameters are initially: gravel, sand, mud (%), rock exposure (%), average grainsize and sorting (phi), carbonate (%). A specification of the parameters is given under usSEABED. dbSEABED uses the Wentworth grain size classification and scale.
It is important that the colour schemes for display of these data be standardized. In dbSEABED this is: rock-purples, gravel-reds, sand-yellows, mud-greens, clay-blues. A collection of ESRI ArcView 3.x and ArcGIS 9.x legends to this standard is available from this web address: GIS Legends.
The format for delivery of gridded data from dbSEABED is the E.S.R.I. ASCII grid format, at finest 0.02 degrees cell size, with WGS 84 datums. The grid extents are grid-centred, i.e. ArcView 3.x format.
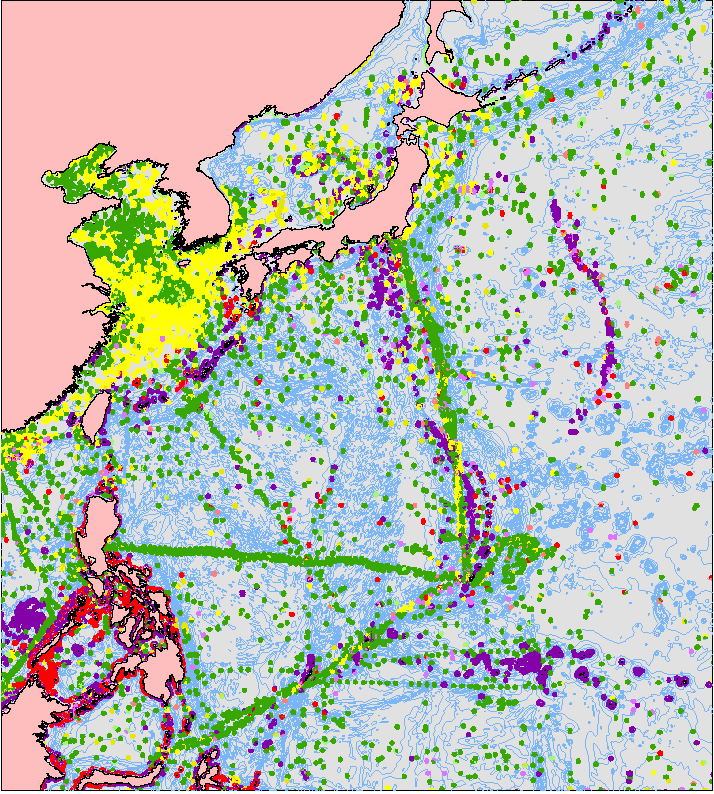
East Asian Seas
|
Grid extents: |
Grid specifications: ncols 900; nrows 1000; cellsize 0.05; NODATA_value -99; generated 27 Feb 2012 |
Underlying data resources 362,000 point data sites from 32 datasets |
| dbSEABED Gridded data on seabed textures |
Zipfile Set
ASCII ESRI grids: domnc = Dominant Bottom Types;
folk = Folk sediment codes;
gvlu = Gravel uncertainties (% abs);
gvlv = Gravel values (%); |
|


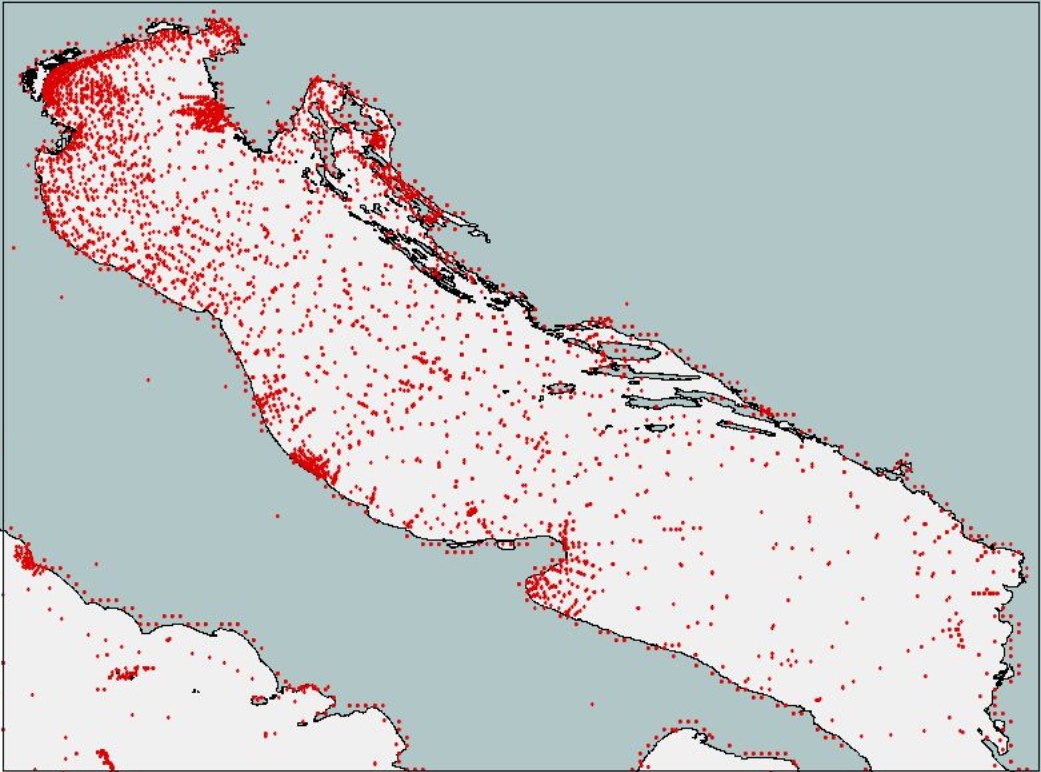
Adriatic Sea
|
Grid extents: bottom left: 12.00°E 40.20°N; upper right: 19.72°E 45.92°N; grid centred |
Grid specifications: ncols 386; nrows 286; xllcorner 12.0; yllcorner 40.2; cellsize 0.02; NODATA_value -99 |
Point Data Pattern: |

|
 |
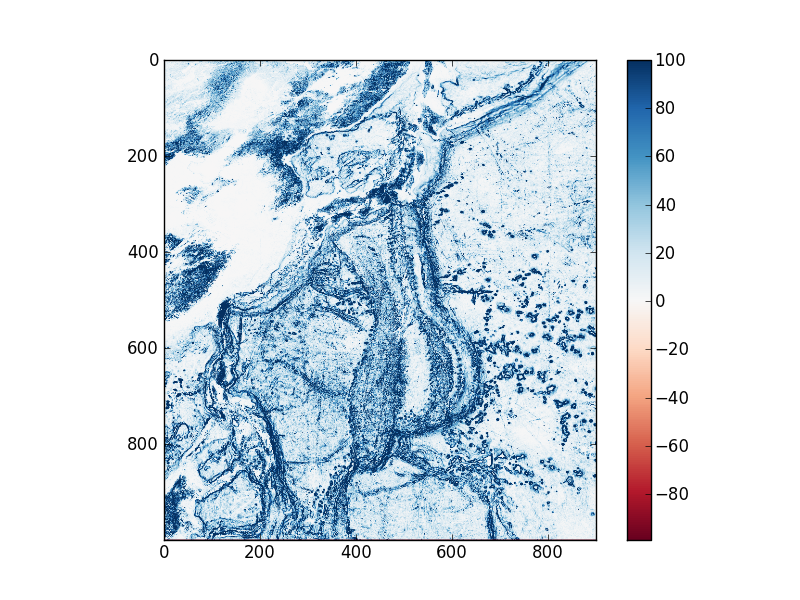
Gravel (%) |  |
Sand (%) |  |
Mud (%) |
 |
Rock (Exposed %) |  |
Substrate Dominances (Classes) |  |
Folk Sediment (Classes) |

|
Uncertainties (Absolute) |
The coverage was formed as a test-bed for the gridding software and to support the EUROSTRATAFORM initiative.
SACLANTCEN, BWB, USGS, A.W.Niedoroda and F.McKinney kindly provided valuable unpublished datasets.
Northern Gulf of Mexico
|
Grid extents: bottom left: 98.19°W 23.36°N; upper right: 80.37°W 31.02°N; grid centred |
Grid specifications: ncols 891; nrows 383; xllcorner -98.19; yllcorner 23.36; cellsize 0.02; NODATA_value -99 |
Point Data Pattern: |
|

| Gravel (%) |  |
 |
Substrate Dominances (Classes) |
| Sand (%) |  |
 |
Folk Sediment Classification |
| Mud (%) |  |
 |
Uncertainties (% absolute) |
| Rock (Exposure, %) |  |
The development of this coverage was funded by the USGS and GSMFC. A Google Earth display of browseable binned data is available.
NMFS at NOAA, USGS (St Petersburg) and USF provided invaluable datasets.
Statements
Suggested Citation
Jenkins, C.J. 2010. Seafloor Substrates. INSTAAR, University of Colorado, Boulder CO USA. [URL: "https://csdms.colorado.edu/wiki/DBSEABED"; Last edit 18 Feb 2010]
Technical Support
In case of queries about content, format and applicability of the data contact Chris Jenkins at INSTAAR.
Queries and comments can also be lodged using the CSDMS Discussion Facility.
Disclaimer
Neither the University of Colorado nor any partner thereof, nor any of their employees, makes any warranty, expressed or implied, or assumes any legal liability or responsibility for the accuracy, completeness, or usefulness of any information, apparatus, product, or process disclosed in this report, or represents that its use would not infringe privately owned rights. Reference therein to any specific commercial product, process, or service by trade name, trademark, manufacturer, or otherwise does not necessarily constitute or imply its endorsement, recommendation, or favoring by the University of Colorado or any partner thereof. Although all data and software published on this web page have been used by the University of Colorado, no warranty, expressed or implied, is made by the University of Colorado as to the accuracy of the data and related materials and (or) the functioning of the software. The act of distribution shall not constitute any such warranty, and no responsibility is assumed by the University of Colorado in the use of this data, software, or related materials.
